You are here
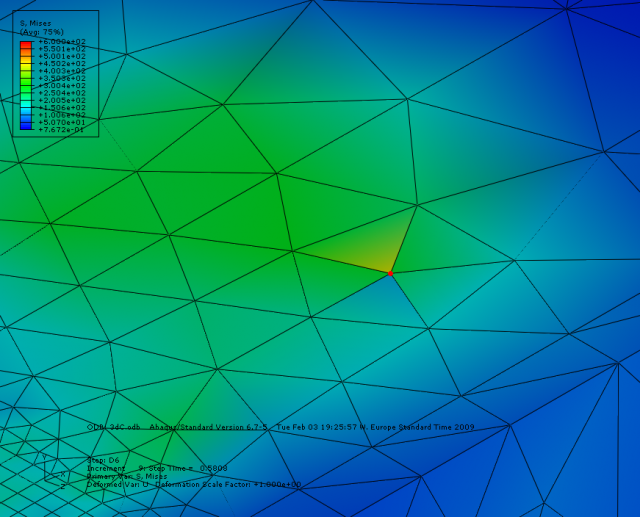
ABAQUS/CAE plots values with discontinuous edges/nodes
The plot is showing a value typically obtained at the integrations points (in this case a single integration point).
Normally you would make a plot like this by taking the mean value of the surrounding elements to each node, then making a interpolated plot like this. However, it is obvious this is not the case around the red node, as it has several different values in the same node.
This behaviour happens quite often for me in ABAQUS/CAE, and it is quite annoying as the strange looking plot makes the results seem less trustworth. It doesn't matter (and shouldn't matter) what kind of analysis that has been performed, since this the interpolation should only have one nodal value, which is the mean of the surrounding elements, regardless.
I am contemplating on filing a bug report to have this unwanted behaviour fixed, but there might be a better explanation to why the plot looks like this. Any insight on this issue is greatly appreciated.


Proprietary software is unacceptable.
I have spent quite some time trying to send a bug report to Simulia regarding this.
After beeing redirected through their site back and forth I found myself beeing forced to create a user account for support questions in order to submit a bug. Support that my university then would have to BUY in order to allow me to take my SPARE time to send a bug report to help them fix their software so they could sell it to us AGAIN.
(Yes, a well written bug report is worth alot. As a software developer I greatly appreciate bug reports to keep my software in top condition)
Unacceptable.
Once again I am reminded why I hate proprietary software, and why I dont think it's acceptable in academics (or science/engineering in general).
A black box in which we are not allowed to look, forcing us to try and validate our results in other ways, often "proving" results by doing benchmarks of other known cases, which can only ever prove a model to be incorrect.
Imagine if you had to buy a mathematical formula, but you did not even get to see it, just put in numbers and see what comes out, "proving" the results by checking a set of inputs.
Excuse me for ranting like this, but I felt that I had to say it.
Well I managed to find the
Well I managed to find the reason for these plots. There is a threshold (adjustable) which determines wether or not a node should be averaged or not depending on how difference there is between the surrounding integrationpoints. I guess this is a good indicator that the mesh it to coarse.
Regardless I stand by my opinions about closed source!
I'm glad you found your
I'm glad you found your answer. The thing about Abaqus and other popular, big FE packages is oftentimes when we think they are doing something wrong, they're doing something smart, we just don't know it.
As time goes on, I grow more and more leary of using proprietary software for scientific computing. As an open-source-lover, I try not to become too zealous, but I really do wish that open source software was more prominent in FEM and it has always shocked me that these commercial codes dominate so much when the methods they use are all (or almost all) widely published publically. There are tons of codes under open source licenses developed all over, but few seem to have much popularity outside wherever they are developed, and all I've seen seem to lack an attempt at polish and genrality of the major commercial codes.
Abaqus in particular has caused me lots of grief. I run into all manner of errors, many of which make no sense, some of which are blatently wrong, few of which are documented anywhere I can find. In a good system one should not need to hunt through the code anyways, but sometimes that would be a lot easier and more reliable than playing the guessing game.