Zifan Wang, Shuvrangsu Das, Akshay Joshi, Angkur JD Shaikeea, Vikram S Deshpande*
*Corresponding author: vsd20 [at] cam.ac.uk
Introduction
Rubber elasticity describes the unique behaviour of polymeric solids composed of flexible chains that form a three-dimensional network. These materials can endure significant deformations and completely recover their original shape. This field, a well-established branch of solid mechanics, is underpinned by detailed molecular theories and extensive macroscopic measurements. Traditional models for rubber elasticity hinge on the Helmholtz free-energy being a function of temperature and deformation alone. However, new findings from three-dimensional X-ray computed tomography (XCT) measurement technique suggest a need to revise our understanding of rubber elasticity. This discussion outlines the development of an XCT method, called Flux Enhanced Tomography for Correlation (FETC), and presents significant discoveries about the deformation behaviour of rubbers and synthetic polymers.
The FETC Method
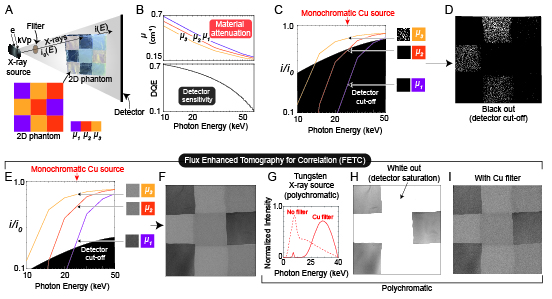
FETC is a laboratory-based XCT method designed to measure full-field 3D strains in solids non-intrusively (Fig. 1). It captures subtle variations in density and other heterogeneities within materials by distinguishing grayscale variations in X-ray attenuation spectra. This natural speckle pattern allows for digital volume correlation (DVC) without the need for artificial tracer particles, reflecting the material's innate response. FETC facilitates detailed measurement of all nine components of the deformation gradient, providing a comprehensive dataset on deformation modes.
Fig. 1: Overview of the principle of Flux Enhanced Tomography for Correlation (FETC) on a 2D phantom made from polymers with similar X-ray attenuation. Figure adapted from [1].
Deformation and Local Volume Changes in Silicone Rubber
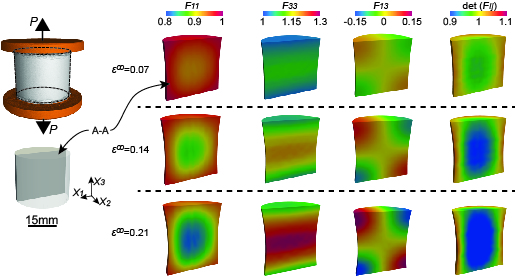
Silicone rubber, a well-characterized elastomer, was tested using cylindrical specimens glued to platens and subjected to tension (Fig. 2) or compression. FETC revealed that these specimens experience local volumetric strains of approximately ±10%, despite the overall specimen volume remaining constant. This observation challenges the traditional assumption that elastomers are incompressible. Under tensile loading, the central core of the specimen loses volume while the outer cylindrical shell gains volume, a phenomenon not captured by existing elastomeric models. This behaviour persists across different specimen aspect ratios, suggesting that local volume changes are a fundamental characteristic of these materials.
Fig. 2: Tension of a cylindrical specimen of silicone rubber (aspect ratio 1:1) and FETC measurements showing various components of the deformation gradient and detF_ij (local volume change) at three different levels of remote strain ε∞, Figure adapted from [1].
Mobile Phase in Rubber
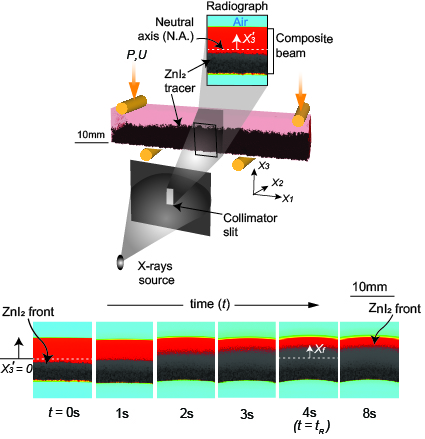
Further investigations into the deformation behaviour of Silicone rubber revealed the presence of a mobile phase within the material (Fig. 3). This phase, composed of un-crosslinked polymer within the crosslinked network, moves in response to deformation gradients, inducing local volume changes while maintaining overall incompressibility. A composite Silicone rubber beam with an X-ray tracer demonstrated that the mobile phase migrates from compressive to tensile regions under bending, confirming its existence and mobility (illustration in Fig. 4).
Fig. 3: A composite beam made from silicone rubber with a tracer (ZnI2) on one side exhibits tracer movement from the compressive side to the tensile side upon bending, as demonstrated in the time-stamped images. Adapted from [1].
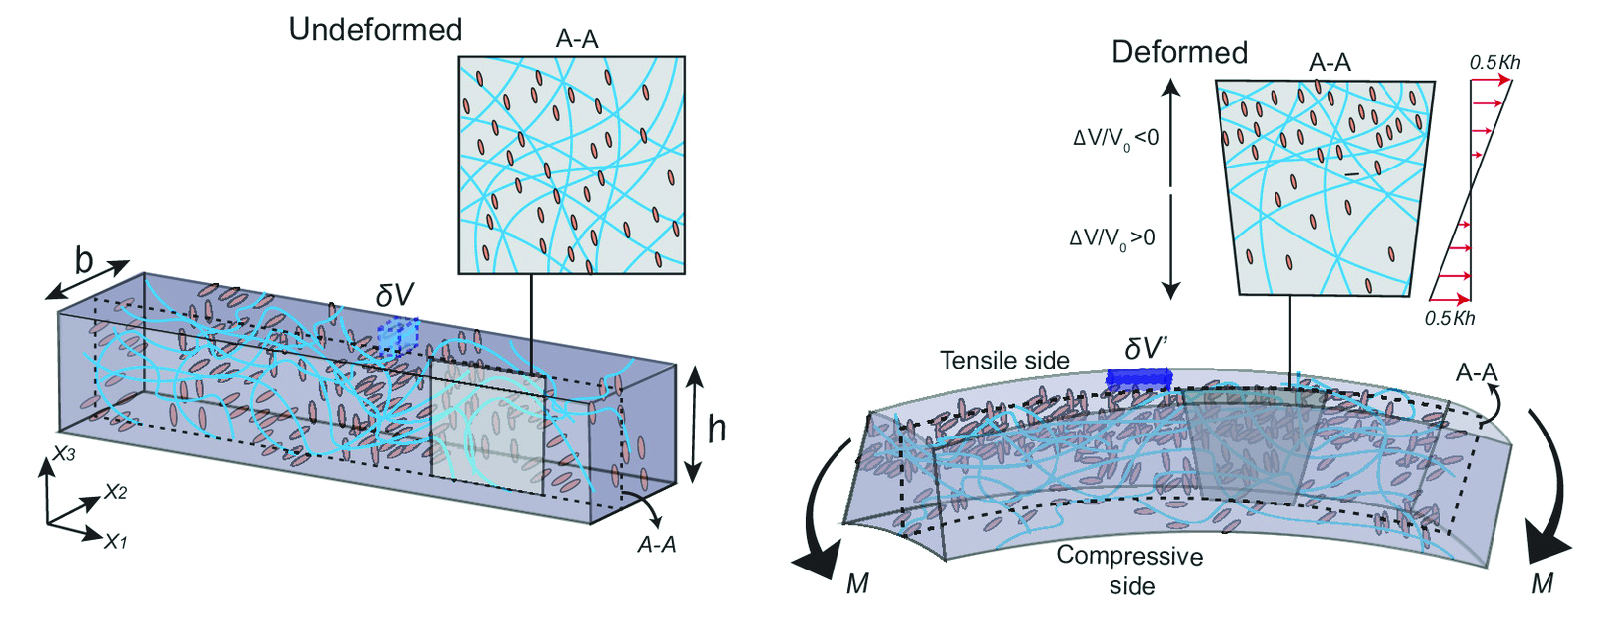
Fig. 4: (Left) Hypothesized molecular structure of silicone rubber in a beam specimen, illustrating an immobile cross-linked network and a mobile phase of ellipsoidal molecules. (Right) Depiction of the beam from under bending stress, showing the evolution of the molecular structure, including the migration of mobile molecules and the resulting increase in volume due to the egress of these species. Adapted from [1].
Thermodynamic Consistency and Model Development
To account for the observed behaviour, a thermodynamically consistent model was developed. This model posits that the Helmholtz free-energy is a function of both deformation and the concentration of the mobile phase. The model successfully predicts the equilibrium responses and spatial variations in volumetric strain observed in experiments. However, the rapid transport of the mobile phase within the rubber, even at high strain rates, suggests that it behaves as a shear-thinning fluid, complicating the definition of a linear diffusion coefficient.
Broader Implications and Applications
The discovery of a mobile phase within rubbers has significant implications for understanding the mechanical behaviour of synthetic polymers, including widely used thermoplastics like Nylon and high-density polyethylene (HDPE). Three-point bend tests on Silicone rubber, Nylon6, and HDPE revealed that all these materials exhibit local volumetric deformations while maintaining overall volume conservation. These findings suggest that the phenomena observed in Silicone rubber are generalizable to other synthetic polymers.
The FETC method has broad applications in the emerging field of data-driven mechanics. It provides the necessary 3D data for developing machine learning models for constitutive law development and opens new avenues for understanding the mechanical behaviour of polymers and composites.
Outlook
The study of rubber elasticity has entered a new phase with the development of the FETC method and the discovery of a mobile phase within rubbers. These findings challenge long-standing assumptions and highlight the need for new state variables to describe the deformation behaviour of rubbers and synthetic polymers. The implications extend beyond fundamental research to practical applications in the design and analysis of polymer-based materials.
1. Wang, Z., Das, S., Joshi, A., Shaikeea, A. J., & Deshpande, V. S. (2024). 3D observations provide striking findings in rubber elasticity. Proceedings of the National Academy of Sciences, 121(24), e2404205121.
| Attachment | Size |
|---|---|
| Fig3.jpg | 706.19 KB |
| Fig2.jpg | 172.68 KB |
| Fig4-01.jpg | 1.55 MB |
| Fig1-01.jpg | 689.54 KB |