Suraj Ravindran
Department of Aerospace Engineering and Mechanics, University of Minnesota
1. Introduction
Materials are subjected to high-velocity impact in applications such as hypersonic flight, space applications, nuclear fusion, etc., which generate strain rates over 104 /s and pressures approaching 100 GPa. Therefore, it is crucial to characterize material flow behavior as a function of pressures and strain rates to develop high-fidelity constitutive models. Four experimental techniques are widely used to measure/infer the strength of materials in these high dynamic regimes: 1) shock and release technique [1], 2) Manganin gage measurements [2,3], 3) Richtmyer-Meshkov instability [4], and 4) pressure shear plate impact (PSPI) [5–7] experiments. The main advantage of the PSPI technique is that it allows for the independent control of pressure and strain rates, which is instrumental in decoupling the rate and pressure effects on the strength of the materials.
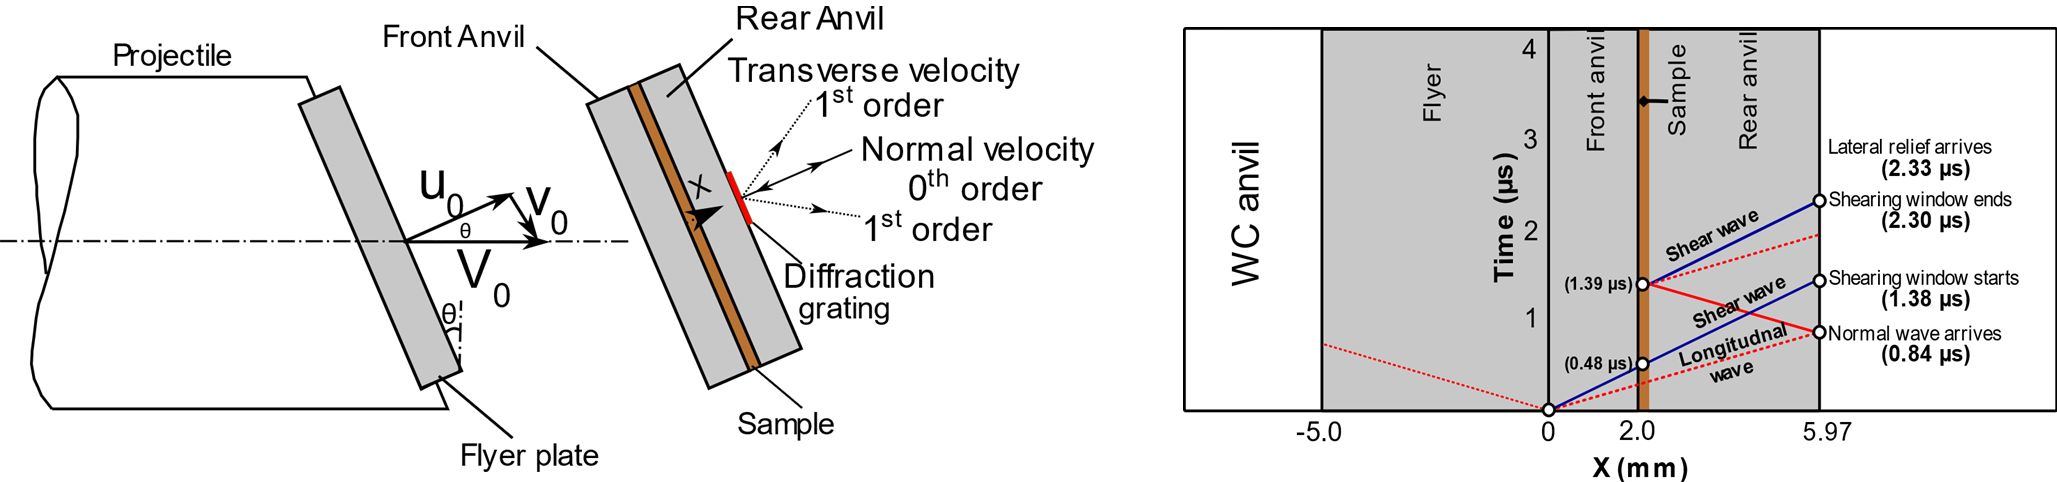
A schematic of the experimental setup and an X-t diagram for the experiment is shown in Fig.1. In PSPI experiments, a thin sample is sandwiched between two high-strength anvil plates, see Fig.1. The skewed impact of the flyer generates both normal and shear waves in the front anvil plate. Since the shear wave is slower than the longitudinal (normal) wave, the sample is initially swept by the normal wave and compressed. The normal wave reverberates within the lower impedance sample, and the normal stress equilibrates to the desired value before the arrival of the shear wave. When the shear arrives, the sample undergoes significant shearing deformation under constant pressure, and this information propagates to the free surface of the rear anvil plate, where the Photonic Doppler velocimeter and Heterodyne transverse interferometers [8] record the normal and transverse particle velocity profiles.
Figure 1. Schematics of the pressure shear plate impact experiments and distance-time (X-t) diagram for the sandwich experiments.
Traditional PSPI experiments assume that the flyer and anvil plates remain linearly elastic under dynamic loading. Characteristic relationships derived from 1-D wave equations transform the normal and transverse particle velocity profiles, measured at the rear surface of an anvil plate, into corresponding velocity histories at the boundary of a thin material specimen sandwiched between two impacting plates. Simple relationships from the elastodynamic analysis are then used to infer the normal and shear stress in the specimen, assuming an equilibrated and uniform state of stress in the material. The elastic anvil analysis limits pressure shear plate impact experiments to pressures lower than the Hugoniot Elastic Limit of anvil materials. Typical anvil materials, such as tungsten carbide (WC), have HEL between 6-8 GPa. Materials such as Diamond have HEL between 60-80 GPa; however, they are not feasible to use in these experiments. Therefore, the pressures achieved with PSPI experiments were limited to 8 GPa. Other anvil materials, such as Sapphire and Zirconia, have HEL close to 20 GPa but have their own challenges not discussed here. Here, we discuss the extension of PSPI techniques into higher pressures, and results from OFHC copper are presented.
2. Extension of PSPI into higher pressure regimes
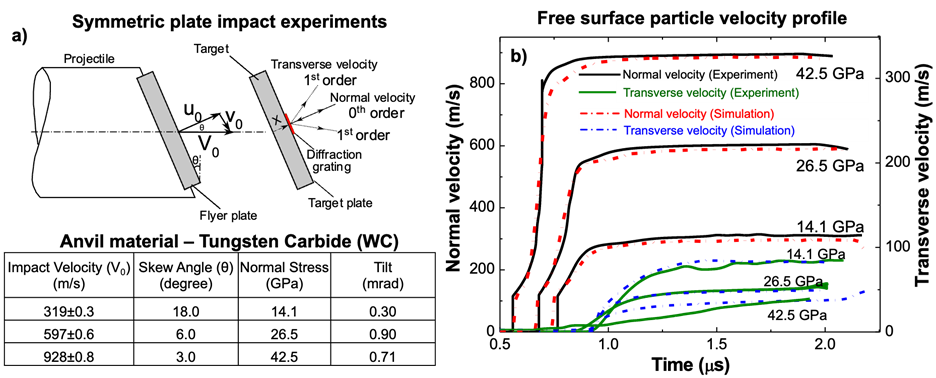
The extension of PSPI experiments to high pressures is achieved by developing a hybrid method to incorporate the plasticity of the anvil materials in the analysis [9]. This method involves the characterization of the anvils at pressures exceeding the HEL using symmetric (flyer and target made of the same materials) impact experiments (Fig. 2a). A material model for the anvils is calibrated (Equation of state (EOS), strength) before the sandwich experiments are performed using the data from these symmetric experiments. Once the material behavior of the anvils is known at similar pressures, the only unknown is the strength (deviatoric) and hydrostatic (volumetric) behavior of the copper sample in the sandwich PSPI experiments. Numerical simulations of the sandwich experiment are performed by varying the parameters of an appropriate material model for copper until simultaneous matching of the longitudinal and transverse free surface velocities with experimental measurements is achieved. In the PSPI experiments performed, WC was used as the anvil material due to its high impedance and strength. Fig.2b shows the normal and transverse particle velocities from the calibrated material models and symmetric experiments on WC at velocities ranging from 319 to 928 m/s [9,10]. In the modeling of WC, a plasticity model with Johnson Cook strain hardening and Cowper Symonds strain rate hardening was used to model strength, while the EOS was modeled using a known linear Mie-Gruneisen EOS [10].
Figure 2. a) Schematics of the experimental setup and table of impact velocities, skew angle, and normal stress, b) free surface normal and transverse particle velocity vs. time.
3. Strength of OFHC Copper under dynamic pressures
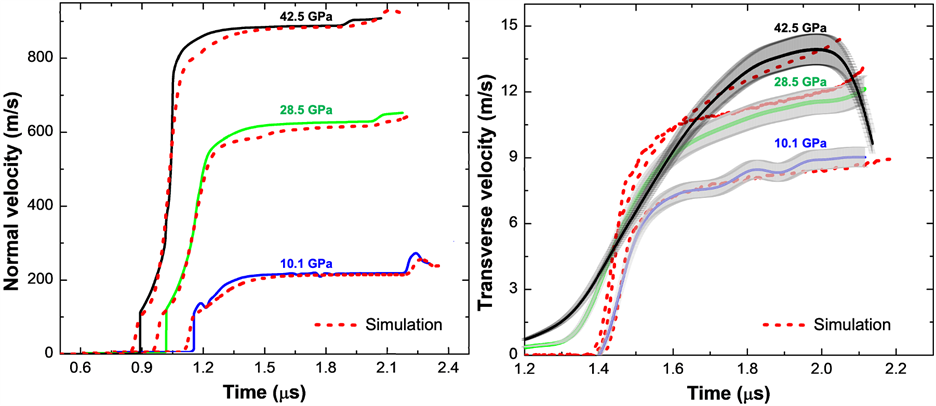
After calibrating the anvil materials, sandwich experiments were conducted on an OFHC copper of 150 mm thickness and 30 mm diameter at pressures varying from 10.1 to 42.5 GPa. The strain rates in these experiments were kept on the order of 100,000/s by appropriately selecting the inclination angle of the impact, which controls the transverse component of the velocity and directly affects the strain rates. Figure 3a and Fig. 3b show the normal and transverse particle velocities obtained from the sandwich experiments. The transverse velocity profile clearly shows that a pressure-dependent material model for copper was required to predict the observed trends in the experiments since the strain rates in all experiments were the same. The well-known Steinberg-Guinan (SG) model [11] was used to simulate the pressure-dependent flow behavior of copper in the numerical simulation.
Figure 3. Normal and transverse velocities from sandwich experiments on copper with WC anvils (solid lines are experiments, and dotted lines represent simulations). a) normal free surface velocity and b) corresponding transverse velocity at different pressures. The shaded areas denote ±5% range of uncertainty for the measured velocity profiles.
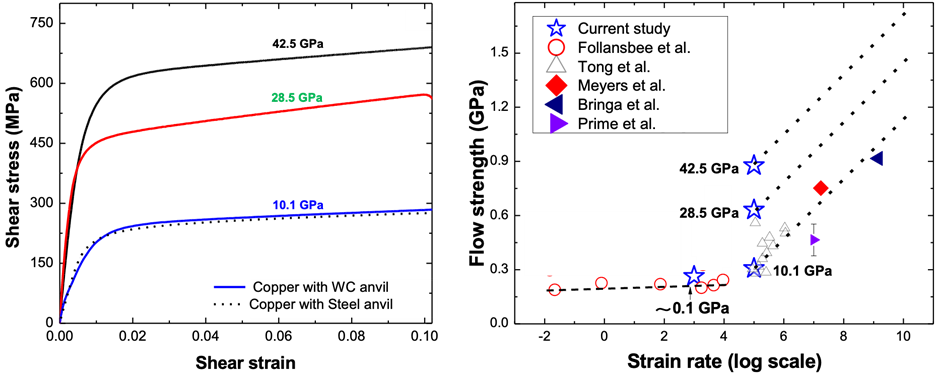
The shear stress-shear strain curves for the experiments at higher pressures deduced from the numerical simulations using the Steinberg-Cochran (SG) model for different pressures are plotted in Fig. 4a. From the SG model simulation, it can be seen that the peak shear strength (at a shear strain of 0.1) increases from 270±16 MPa to 670±40 MPa (factor of 2.5) while the pressure increases from 10.1 to 42.5 GPa (factor of 4.2). The peak shear strength was 307±10 MPa, 580±38 MPa, and 670±46 MPa for 10.1 GPa, 28.5 GPa and 42.5 GPa, respectively. The flow stress of the copper from previous studies at different strain rates is shown in Fig.4b [12–16]. Comparing the data at 10.1 GPa and strain rate of 105 s-1 from the present study lies in the region of the previously reported values at similar strain rates and pressures [13], see Fig. 4b. However, at nominally same strain rate, the strength increases with pressure, as discussed earlier, and the possible extension of the rate-dependent behavior is shown in Fig. 4b. It will be of great interest to perform experiments at higher strain rates at a fixed pressure to investigate the effect of high pressures on strain rate hardening, which is difficult to achieve with other experimental techniques.
Figure 4. a) Shear-stress shear strain curve for OFHC copper at different pressures, b) flow strength plotted as a function of strain rate.
4. Yield strength scaling with shear modulus
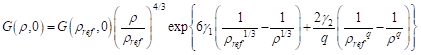
In many pressure-dependent strength models, the shear strength and yield strength scaling are approximated to be the same. To check the validity of such assumptions, the shear modulus was theoretically calculated at different pressures using the Burakovsky-Greeff-Preston (BGP) [17] model to understand the yield strength scaling with the shear modulus. The BGP model was developed to capture the shear modulus of materials over a range of pressures and compares relatively well with the first-principles calculations. The cold shear modulus (G at 0 K) as a function of density is given by
The parameters for the model for copper can be found in [17]. The shear modulus was calculated along the isotherm at different pressures using BGP model. Figure 5 shows the calculated shear modulus normalized with the shear modulus at zero pressure. It shows a linear increase in the shear modulus with respect to pressure, and the slope of the linear fit was close to 24 TPa-1. Interestingly, for copper, the slope of the normalized shear modulus with respect to pressure was reported previously as 28 TPa-1, which is close to the predicted slope from the BGP model. For comparison, the shear modulus as a function of pressure using the SG model at 300 K is also plotted in Fig.5. The yield strength at different pressures from the present study normalized with the yield strength at zero pressure is also shown in Fig. 5. The yield strength scales much steeper with pressure compared to the shear modulus. The slope of the yield strength (~ 60 TPa-1) is close to 2.6 times the theoretically predicted slope of shear modulus variation with respect to pressure. It is worth noting that the pressure scaling of the yield strength in tantalum was reported to be two times the shear strength scaling [18], and the low dislocation mobility explained this increased pressure dependency at high pressures. The Peierls stress in copper is relatively small (~ 3 MPa); therefore, the lattice friction does not affect the strength of copper significantly at higher pressures. Jung et al. [19] showed that the work required to move the dislocations is a function of shear modulus and the dislocation migration volume, and both these quantities are noted to increase with pressure. The steeper dependence of the yield strength on pressure is directly correlated to the dislocation migration volume. It was shown that the critical pressure at which the copper with a grain size of 110 µm generates twins is close to 17 GPa. Therefore, in the high-pressure regime, the new grain boundaries formed due to twinning can also be a barrier to dislocation movement.
5. Summary and future
- The capability of the pressure shear plate impact (PSPI) experiment to measure strength has been extended to high pressures ~ 50 GPa. A new method incorporating anvil plasticity is implemented and validated. This capability provides a unique and powerful experimental capability to investigate materials under extreme pressures and strain rates.
- PSPI experiments reveal that the flow strength of copper increases by 2.8 times when pressure increases from 10 to 42 GPa at a fixed strain rate of 105 s-1.
- Contrary to the conventional assumption, the scaling of the shear strength of copper appears to be significantly different from the shear modulus scaling with pressure.
- The mechanisms for the particular yield strength scaling with pressure are still being studied and require in-depth multiscale investigations. Advanced high-power X-ray facilities at SLAC, Stanford, and the Dynamic Compression Sector at Argonne National Lab provide unique capabilities to explore these phenomena in detail.
References
[1] J. Lipkin, J. Asay, Reshock and release of shock‐compressed 6061‐T6 aluminum, J. Appl. Phys. 48 (1977) 182–189.
[2] Z. Rosenberg, Review on lateral stress measurements with piezoresistive gauges, in: American Institute of Physics, 2000: pp. 1033–1038.
[3] R.A. Graham, Measurement of Wave Profiles in Shock-Loaded Solids, in: K.D. Timmerhaus, M.S. Barber (Eds.), High-Press. Sci. Technol. Vol. 1 Phys. Prop. Mater. Synth. Vol. 2 Appl. Mech. Prop., Springer US, Boston, MA, 1979: pp. 1886–1901. https://doi.org/10.1007/978-1-4684-7470-1_229.
[4] A.R. Piriz, J.J. López Cela, N.A. Tahir, D.H.H. Hoffmann, Richtmyer-Meshkov instability in elastic-plastic media, Phys. Rev. E 78 (2008) 056401. https://doi.org/10.1103/PhysRevE.78.056401.
[5] A. Abou-Sayed, R. Clifton, L. Hermann, The oblique-plate impact experiment, Exp. Mech. 16 (1976) 127–132.
[6] R.J. Clifton, R.W. Klopp, Pressure-shear plate impact testing, Met. Handb. 8 (1985) 230–239.
[7] K. Kim, R.J. Clifton, P. Kumar, A combined normal‐and transverse‐displacement interferometer with an application to impact of y‐cut quartz, J. Appl. Phys. 48 (1977) 4132–4139.
[8] C. Kettenbeil, M. Mello, M. Bischann, G. Ravichandran, Heterodyne transverse velocimetry for pressure-shear plate impact experiments, J. Appl. Phys. 123 (2018) 125902.
[9] C. Kettenbeil, Z. Lovinger, S. Ravindran, M. Mello, G. Ravichandran, Pressure-shear plate impact experiments at high pressures, J. Dyn. Behav. Mater. 6 (2020) 489–501.
[10] S. Ravindran, V. Gandhi, Z. Lovinger, M. Mello, G. Ravichandran, Dynamic Strength of Copper at High Pressures Using Pressure Shear Plate Experiments, J. Dyn. Behav. Mater. (2021) 1–14.
[11] D. Steinberg, S. Cochran, M. Guinan, A constitutive model for metals applicable at high‐strain rate, J. Appl. Phys. 51 (1980) 1498–1504.
[12] P. Follansbee, G. Gray III, Dynamic deformation of shock prestrained copper, Mater. Sci. Eng. A 138 (1991) 23–31.
[13] W. Tong, R.J. Clifton, S. Huang, Pressure-shear impact investigation of strain rate history effects in oxygen-free high-conductivity copper, J. Mech. Phys. Solids 40 (1992) 1251–1294.
[14] M.A. Meyers, F. Gregori, B. Kad, M. Schneider, D. Kalantar, B. Remington, G. Ravichandran, T. Boehly, J. Wark, Laser-induced shock compression of monocrystalline copper: characterization and analysis, Acta Mater. 51 (2003) 1211–1228.
[15] E.M. Bringa, A. Caro, Y. Wang, M. Victoria, J.M. McNaney, B.A. Remington, R.F. Smith, B.R. Torralva, H. Van Swygenhoven, Ultrahigh strength in nanocrystalline materials under shock loading, Science 309 (2005) 1838–1841.
[16] M.B. Prime, W.T. Buttler, M.A. Buechler, N.A. Denissen, M.A. Kenamond, F.G. Mariam, J.I. Martinez, D.M. Oró, D.W. Schmidt, J.B. Stone, Estimation of metal strength at very high rates using free-surface Richtmyer–Meshkov instabilities, J. Dyn. Behav. Mater. 3 (2017) 189–202.
[17] L. Burakovsky, C.W. Greeff, D.L. Preston, Analytic model of the shear modulus at all temperatures and densities, Phys. Rev. B 67 (2003) 094107.
[18] J. Brown, M. Prime, N. Barton, D. Luscher, L. Burakovsky, D. Orlikowski, Experimental evaluation of shear modulus scaling of dynamic strength at extreme pressures, J. Appl. Phys. 128 (2020) 045901.
[19] J. Jung, A note on the influence of hydrostatic pressure on dislocations, Philos. Mag. A 43 (1981) 1057–1061.
| Attachment | Size |
|---|---|
| Picture1.png | 180.85 KB |
| Picture2.png | 113.15 KB |
| Picture3.png | 114.84 KB |
| Picture4.png | 76.8 KB |
| Picture5.png | 3.13 KB |