Hi,
I have got experimental data for a steel material for a cyclic test performed in the following scenario:
0-1% Torsion followed
by
0-1% strain Tension followed by
1-2% Torsion followed by
1% to 0 % compression followed by
2 to 3% torsion followed
by
0 to -1% compression followed by
3 to -1% torsion
followed by
-1 to 0% tension followed by
-1 to 0%
torsion
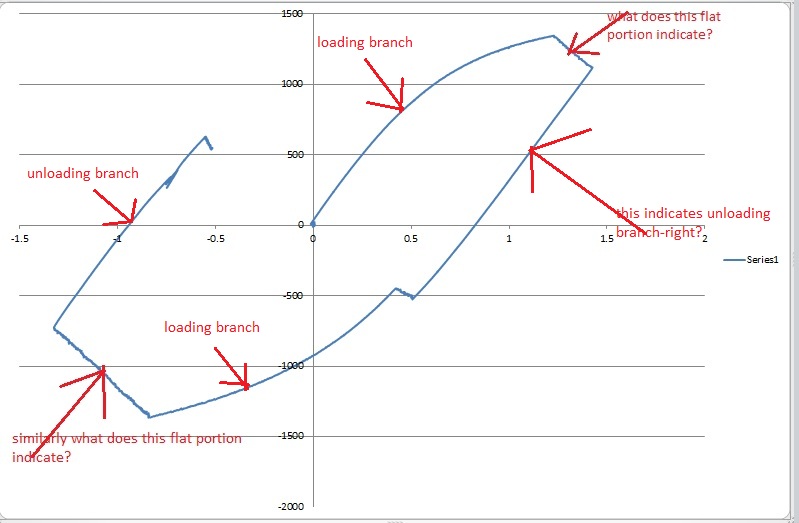
I'm attaching the figure- that is: the stress strain curve for
the tension compression cycle i.e for the cycle corresponding to 0-1% strain- 1%
to 0% compression - 0% to -1% compression and -1 to 0% tension.
I have
indicated the branch corresponding to loading and unloading in the figure that
I'm attaching.
I'm currenly not able to establish contact with the
experimentologist as the data is very old in the university where I'm doing research- could anyone please let me know what does the flat
portion indicate? (I have marked the portion).
The fattached file is
named flat_portion.jpg.
I shall be grateful if helped.
| Attachment | Size |
|---|---|
| flat_portion.jpg | 67.39 KB |