Dear users,
I am an aerospace engineering student learning finite element method and Abaqus.
I have been searching on this forum to solve my problem, but I haven't found useful information yet.
Hence, I try to explain my problem as clear as possible hoping that someone would be so nice to give me his opinion.
-What I would like to obtain: amplitude and phase of a frequency response function FRF [mm/N] of a point in a plate when I load (concentrated load) the structure with a frequency sweep and measure the displacement at the loaded point.
-What I did: I have used the Steady State Dynamics (Modal) procedure defining my frequency range of interest, I have plotted the nodal displacement, taken the absolute value and then divided it by the absolute value of the applied force (constant).
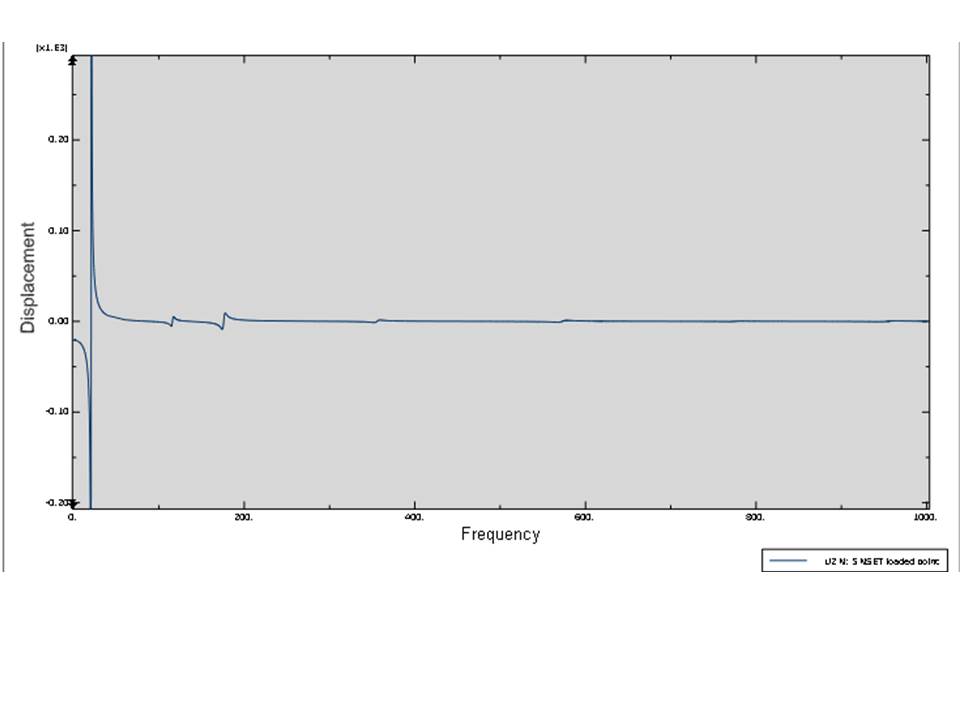
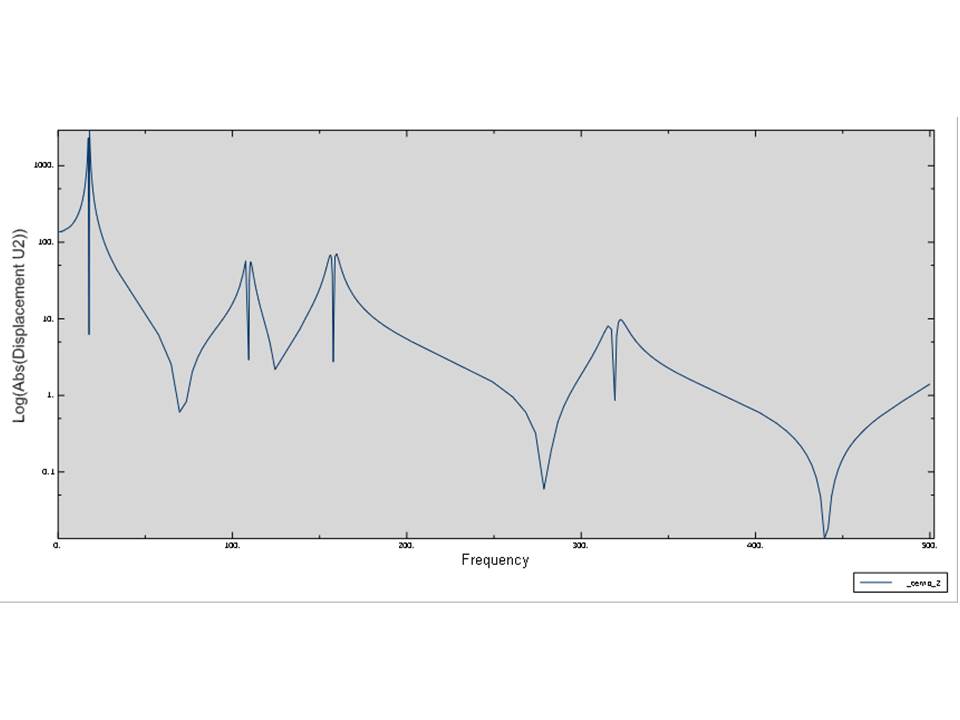
-Problem: at resonances the displacement changes sign because of the change of phase. Thus, at resonances the displacement is zero. As I take the logarithm, values go to -infinity and vertical lines appear in the FFR as depicted in the attached images.
How could I get rid of this problem?.
How could I plot the phase of the FRF?.
Thank you for taking the time to consider my post.
Have a nice day,
Marcossi
| Attachment | Size |
|---|---|
| Displacement vs Frequency | 26.46 KB |
| Logarithm of the absolute value of the displacement | 28.72 KB |