I. Introduction
Although additive manufacturing (AM) has found application across many industries such as aerospace, automotive, and biomedical [1-4], the transient nature of the process makes it challenging to study the complex phenomena that occur during the fast solidification. Some in-situ monitoring techniques such as high-speed imaging and thermal imaging have been employed for quality control as well as to capture information about the melt pool such as surface temperature and melt pool stability [5]. However, these methods can only probe the surface, and any sub-surface inspection must be done post-mortem. In contrast, synchrotron X-ray imaging and diffraction can penetrate through thick samples to give information about the melt pool and solidification mechanics, overcoming the shortcoming of optical and thermal imaging [6]. Here, we give three examples of how synchrotron X-ray diffraction (XRD) studies can be coupled with post-mortem microstructural characterization techniques to reach a fundamental understanding of the complex relationship between process and microstructure in AM. In the first example, we explore the relationship between grain boundary roughness and solidification in stainless steels. In the second example, we show that the solidification pathway of high entropy alloys impacts their resulting grain sizes. Finally, we discuss thermo-mechanical deformation modes during solidification of Inconel 625 using synchrotron XRD.
II. Setup
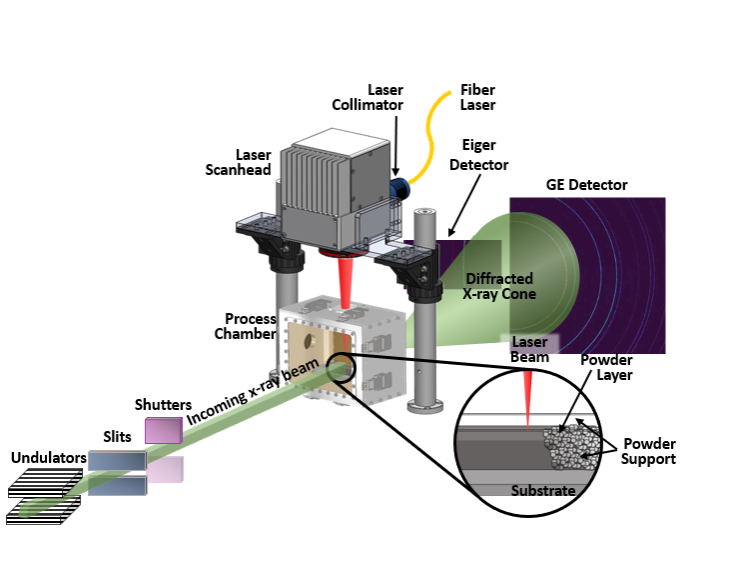
Laboratory of Advanced Materials and Manufacturing (LAMM, Cornell University, Ithaca, NY) has developed a custom setup for operando monitoring of the AM process using high-energy synchrotron source (Figure 1). The laser source is a 500 W continuous wave (CW) multi-mode laser from IPG Photonics. The process chamber, made of aluminum, contains a UV-fused silica window with a near-infrared protective coating, as well as two Kapton polyimide film windows of 0.127 mm thickness that allow X-rays to enter and exit. The x-y stage system consists of two motorized Thorlabs LNR50 stages that can print on the x and y-axis with a motion range of 50 mm. The custom setup is built with modular components such that direct energy deposition (DED) conditions can also be simulated using a powder feeder [7]. The powder feeder delivery channel has a 5MPE feeder from Oerlikon Metco and uses argon as a carrier gas with air to vibrate the hopper filled with powders. The nozzle is attached to the chamber via a telescopic joint and mounted on a Thorlabs y-axis motion stage to always ensure the focal point of the laser always intersects with the powder stream during multi-layer printing. The setup was integrated into the Forming and Shaping Technology ID3A (FAST) beamline of the Cornell High Energy Synchrotron Source (CHESS) and used high-energy monochromatic hard x-rays with an energy of 61.332 keV and a wavelength of 0.2022 Å.
Figure 1: Schematic of custom AM setup integrated at Cornell High Energy Synchrotron Source (CHESS). The setup includes an optical component (laser collimator, fiber laser, and scanhead), a process chamber in which the powder and substrate are laid out, and an incoming x-ray beam controlled by undulators, slits, and shutters. On the other side of the incoming x-ray beam, detectors can be positioned as desired; in the schematic, two detectors were placed (a CdTe Eiger 500k area detector and a far-field GE 51-RT+ area detector), which took measurements at 100 Hz and 4 Hz, respectively.
For section III (Solidification pathway and microstructure), an X-ray beam with a square cross-section of 0.750 mm x 0.750 mm in transmission mode was used. The experiment involved a CdTe Eiger 500k area detector with 512 x 1024 pixels and a far-field GE 51-RT+ area detector with 2048 x 2048 pixels, each covering azimuthal angles from 172.4˚ to -172.3˚ and -90.9˚ to 91.8˚, respectively. The Eiger detector captured data at 100 Hz and the GE detector at 4 Hz, which were found to be the highest temporal resolution attainable without signal-to-noise ratio deterioration. The higher frequency on the Eiger detector provided insight into the fast evolution of solidification, while the dataset from the GE detector captured a more extensive part of the diffracted cone. Azimuthal integration of the Debye-Scherrer diffraction patterns from the Eiger detector was carried out using GSAS-II [8].
For section IV (Deformation modes in AM), a Mixed Mode Pixel Array Detector (MM-PAD) was used due to its fast acquisition rate and high dynamic range. The MM-PAD consists of a 2 x 3 tiled array with a configuration of 256 x 384 active pixels and a pixel size of 0.15 mm x 0.15 mm and achieves full well depths of 4.6 x 10⁸ keV. The detector captures peaks along the given azimuthal range of 85°-95°, with a strain uncertainty between 0.00010 and 0.00025.
III. Solidification pathway and microstructure
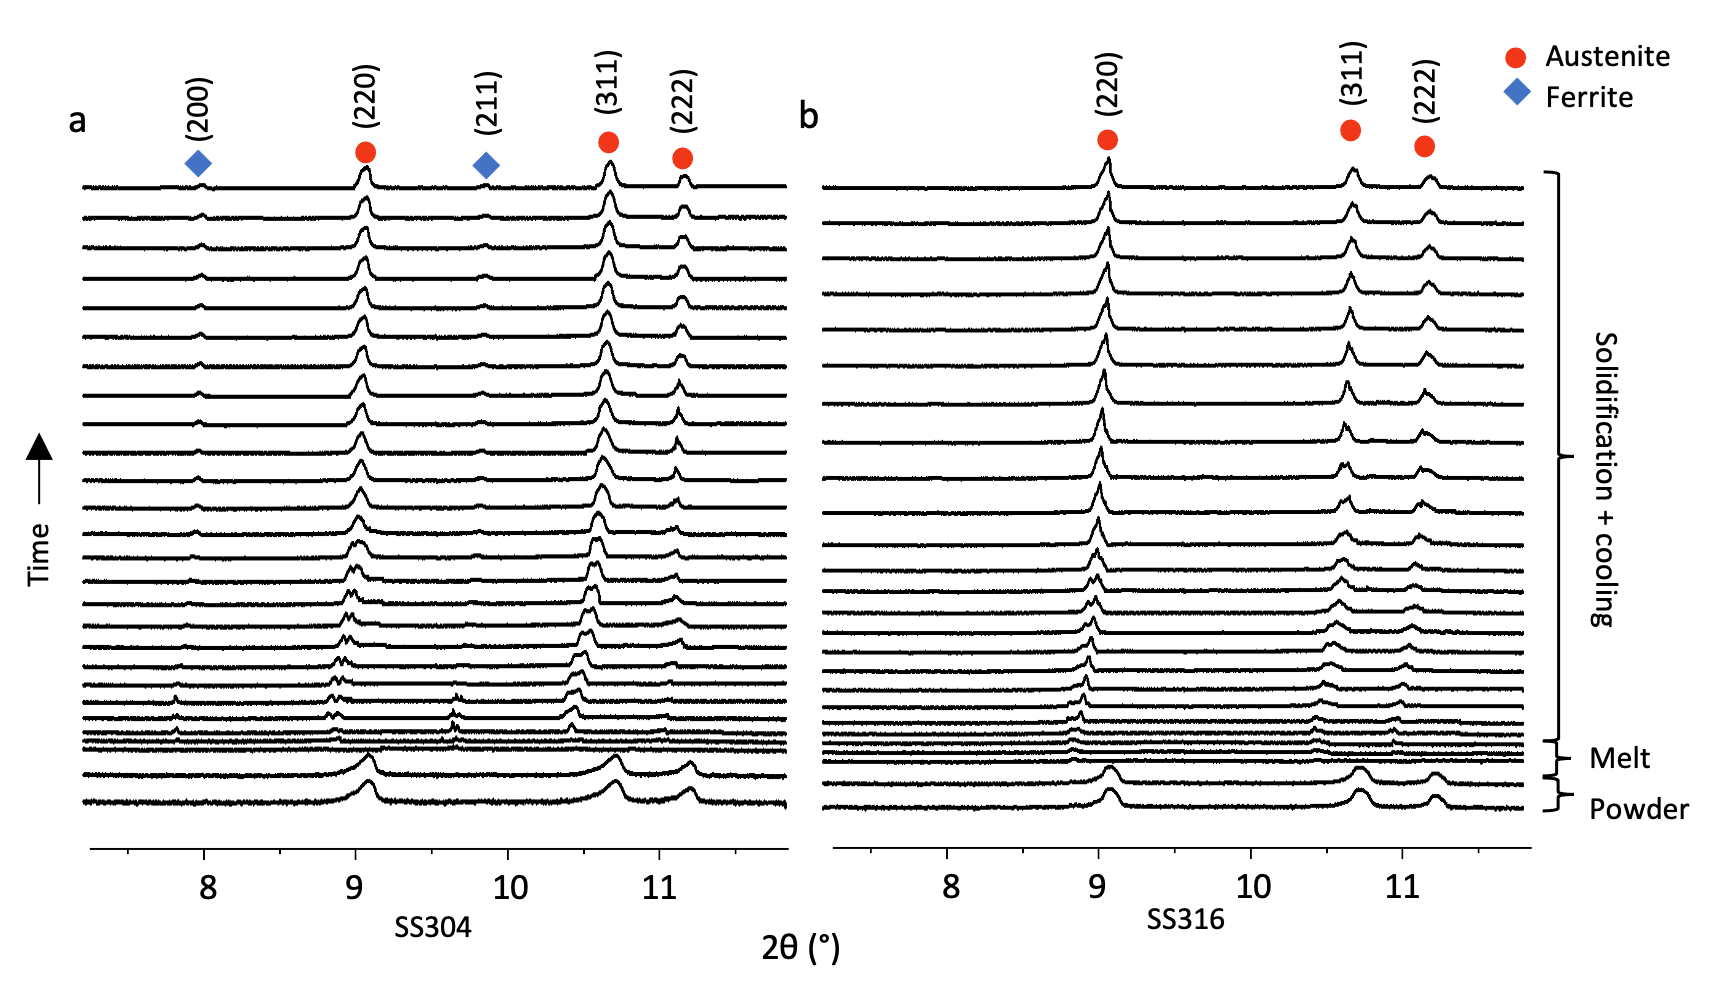
A critical component of solidification in any material is its solidification rate – this largely determines the solidification pathway and resulting microstructure [9]. Using the setup, we gain insight into the relationship between composition, solidification pathway, and microstructure in two common stainless steels, 304L (SS304) and 316L (SS316) [10]. The two austenitic stainless steels were printed using gas-atomized SS304 and SS316 powders with particles sizes ranging between 15 µm and 45 µm (Carpenter Technology, Philadelphia, PA). The printing process parameters used were a laser power of 200W, a scanning velocity of 6 mm/s, and a layer height of 2mm in an Argon atmosphere. The data acquired on the Eiger detector was integrated along the azimuth to produce 1-dimensional X-ray diffraction plots stacked against time (Figure 2). Figure 2a and 2b show results for SS304 and SS316 respectively, both materials showing peaks corresponding to the stable austenitic phase (marked by red circle). It is only in SS304 that we observe the emergence of peaks corresponding to a secondary phase, a metastable ferrite (marked by blue diamonds). This shows clear evidence of the contrasting solidification pathways that take place between the two materials at the same nominal processing conditions.
Figure 2: (a,b) stacked 1-dimensional X-ray diffraction (XRD) plots integrated along the azimuth for SS304 and SS316, respectively. As time goes on, the diffraction pattern changes from powder, melt (amorphous/little to no signal), and solidification and cooling. The apparent decrease in 2θ values for both materials after melting reflects the rise in temperature, with a gradual increase in 2θ as the material cools.
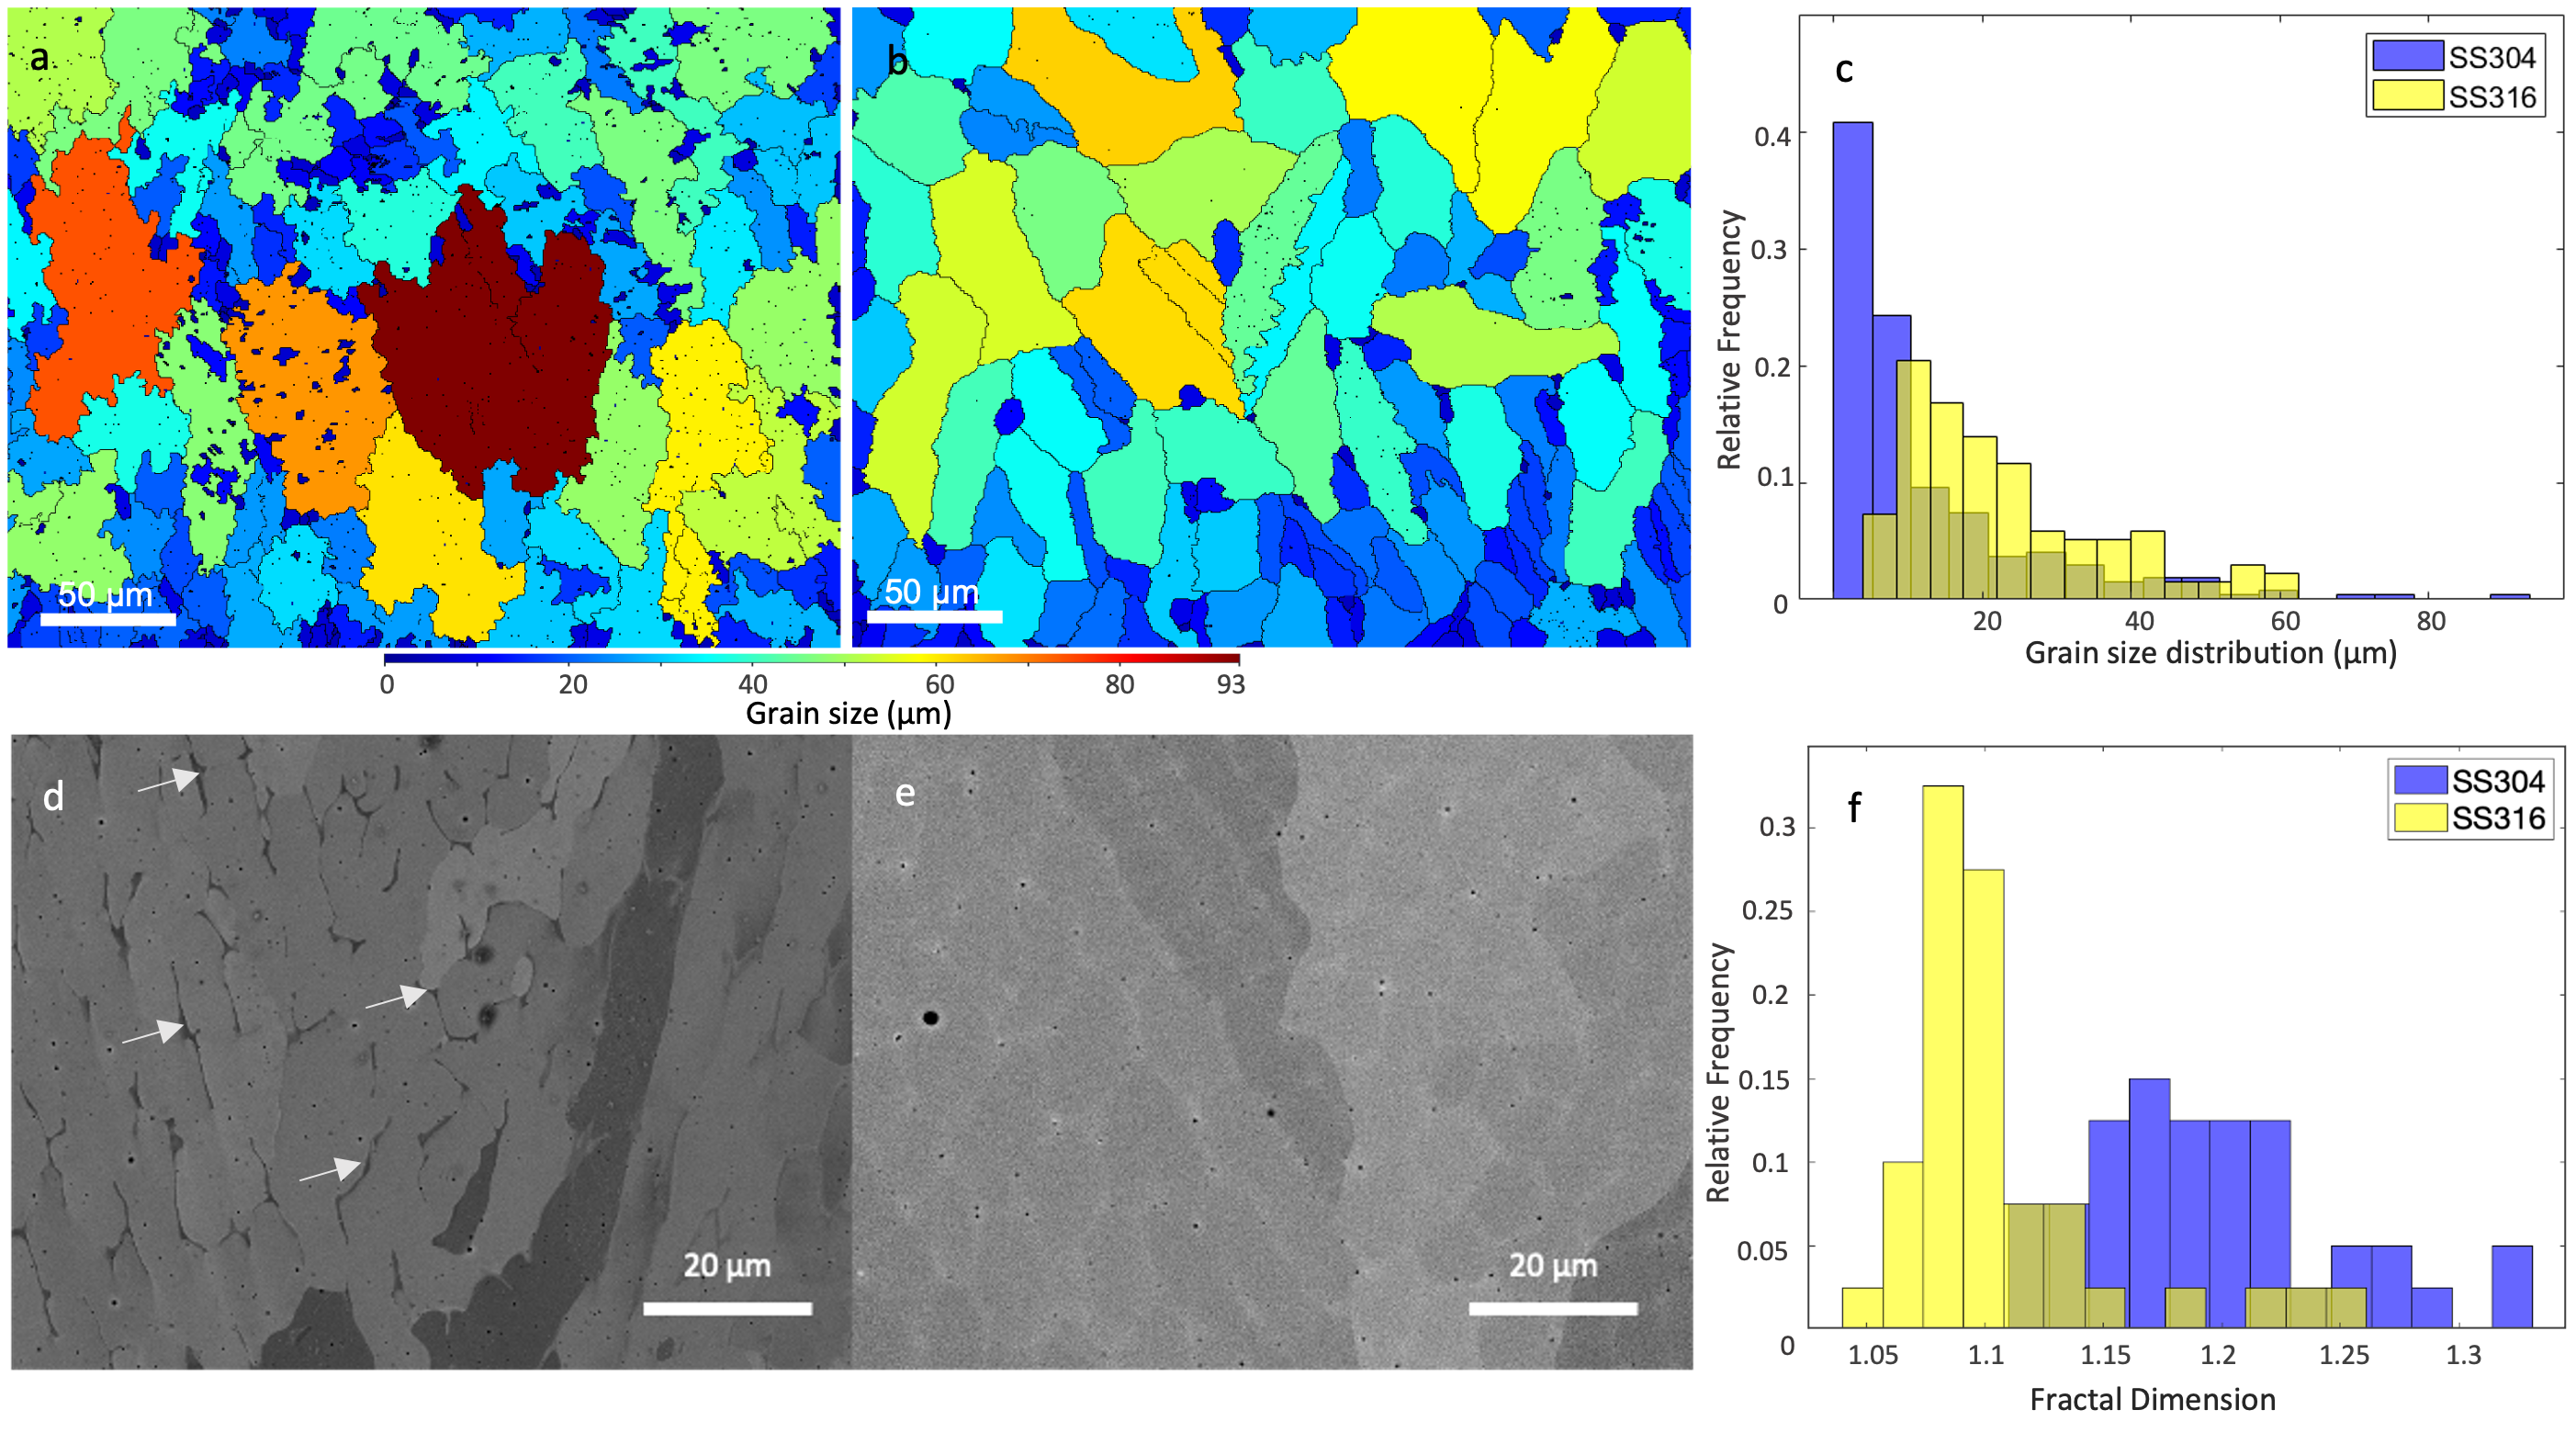
Cross-sectional microstructural evaluation gives insight into the effect of solidification pathway on microstructure. The resulting tracks were sectioned parallel to the scan direction, mounted, and polished using standard metallographic procedures down to a colloidal silica of 0.02 µm. The polished surfaces were then imaged using a Tescan Mira3 field-emission scanning electron microscope (FE-SEM) equipped with a backscattering detector. The grain morphology and phase makeup were analyzed using electron backscatter diffraction (EBSD) with a QUANTAX EBSD, which had a viewfield of 300 µm, a step size of 0.61 µm, and high voltage of 25 kV. The resulting measurements were processed using ATEX (Metz, France). The grain size maps for both SS304 and SS316 can be seen in Figure 3a and 3b.
Figure 3: (a,b) Grain size maps of SS304 and SS316, respectively. (c) Histogram of grain size distribution extracted from EBSD. (d,e) Backscatter electron (BSE) images of SS304 and SS316, respectively. Some spots of retained ferrite are indicated by arrows. (f) Histogram of fractal dimensions for grain boundaries of SS304 and SS316.
The two grain morphologies in SS304 and SS316 are characteristically different – in particular, SS304 has rough grain boundaries while SS316 has smooth ones. The grain boundaries in Figure 3a can be classified as ‘fractal’ grain boundaries due to their resemblance to fractal objects. Fractal dimensions are assigned based on the space-filling nature of the object with respect to a standard geometric shape, where a higher fractal dimension reflects the higher complexity of the shape. The fractal dimensions of 40 grains were calculated using an ImageJ plug-in (FracLac, NIH, Bethesda, MD) to quantitatively compare the grain morphologies, whose distribution is plotted in a histogram (Figure 3f). The mean fractal dimension of SS304 was 1.20±0.05, while the mean fractal dimension of SS316 was 1.10±0.04. The higher fractal indices of grain boundaries in SS304 suggest that the sample’s grain morphology is more irregular. A two-tailed t-test was conducted to determine the statistical significance between the grain boundary roughness. The null hypothesis assumes that there is no divergence between the fractal dimensions of grain boundaries in SS304 and SS316, and their distributions were assumed normal. The resulting p-value was 4.89x10⁻¹², leading to the rejection of the null hypothesis with a 99% confidence level.
The high fractal dimension in SS304 occurs due to the solidification pathway observed during synchrotron XRD studies. The backscatter electron (BSE) images shown in Figure 3d and 3e of SS304 and SS316 reveal that ferrite is retained around solidification cell boundaries in SS304 (indicated by arrows), which pins the grain boundaries to give the rough shape. The fractal grain boundaries are projected to enhance mechanical properties such as creep rupture and fracture strength by increased fracture path and friction between grain boundaries to prevent grain rotation [11,12]. Solidification pathway engineering is demonstrated here as a viable parameter for grain boundary engineering in AM without the need for post processing.
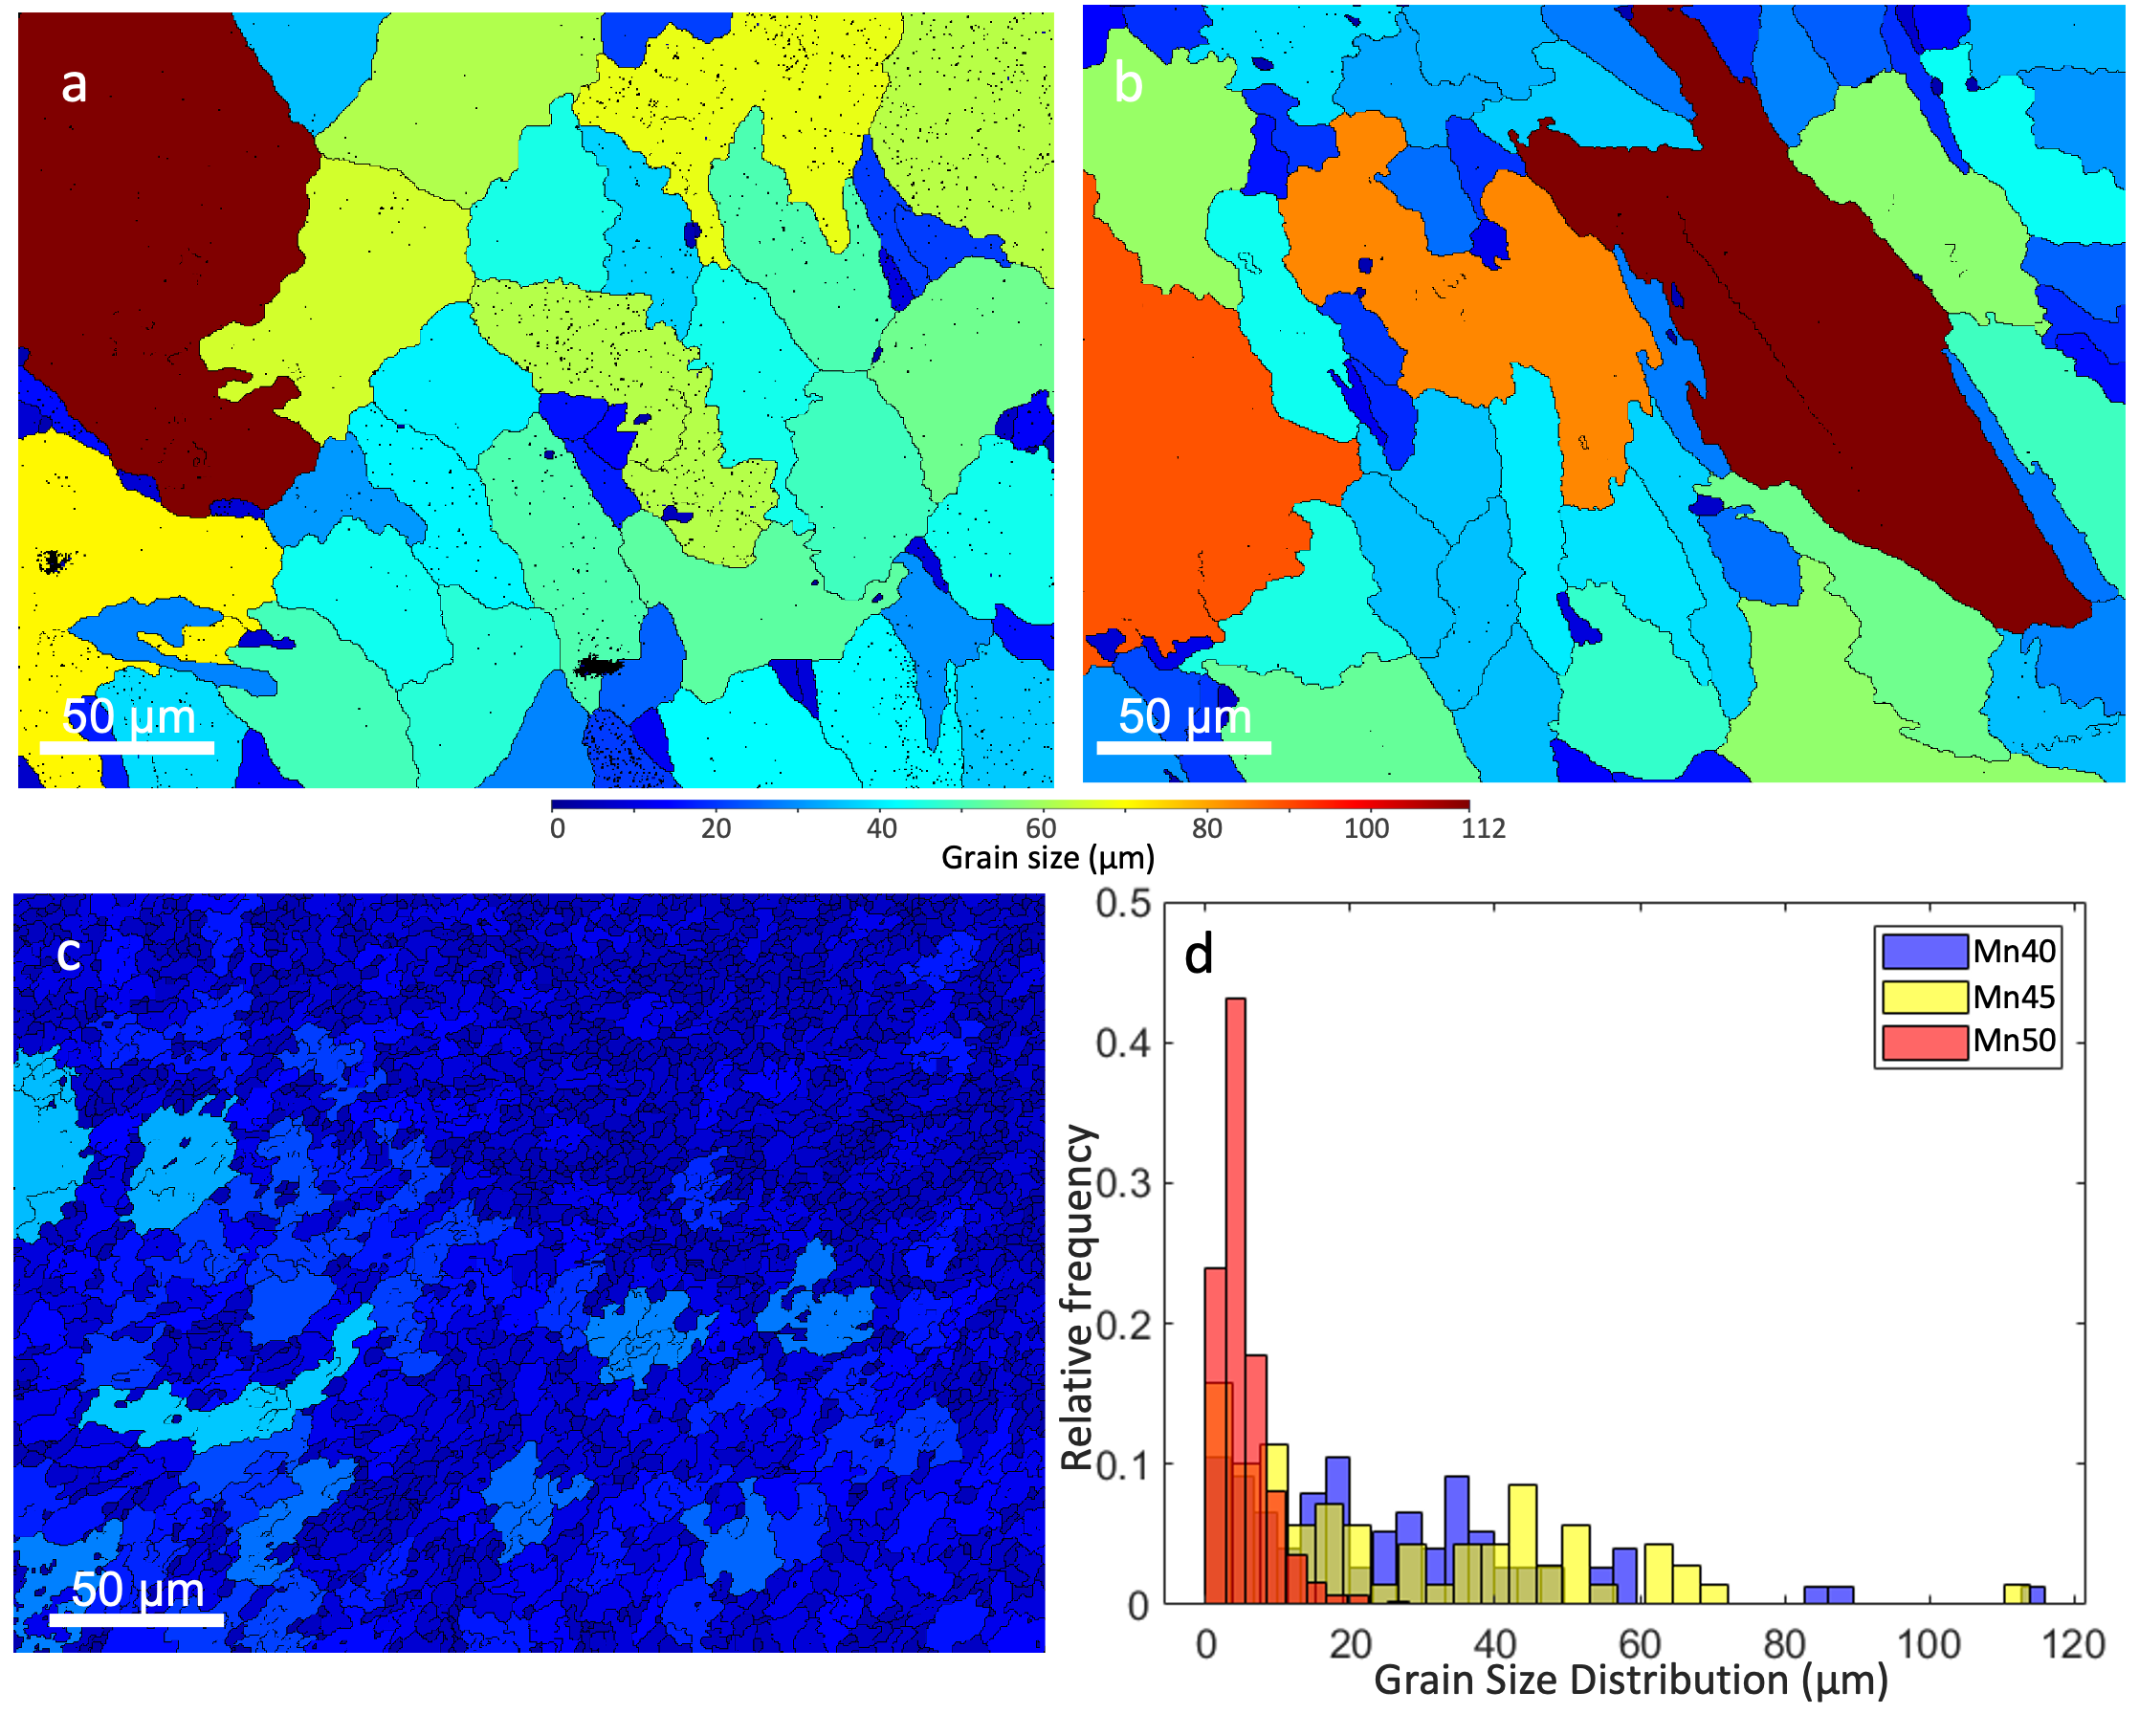
When processed under the same nominal conditions as the stainless steels, high entropy alloys consisting of FeMnCoCr (Fe80-xMnxCo10Cr10, x=40, 45, 50 at. %) show grain refinement with varying solidification pathway. Figure 4a-c show the grain size maps of Fe40Mn40Co10Cr10 (Mn40), Fe35Mn45Co10Cr10 (Mn45), and Fe30Mn50Co10Cr10 (Mn50), respectively. In both Mn40 and Mn45, the only present phase is austenite throughout the process. However, there is an emergence and disappearance of an intermediate phase in Mn50, which is accompanied by a 73% reduction in average grain size between Mn40 and Mn50. Gaining information about the solidification pathway is vital to understanding the mechanism of grain refinement.
Figure 4: (a-c) Grain size maps of of Mn40, Mn45, and Mn50, respectively. (d) Histogram of grain sizes for Mn40, Mn45, Mn50.
IV. Deformation modes in AM
Thermomechanical deformations due to torsional and bending forces during AM may lead to the rigid body rotation of the growing dendrites in constrained melt pool geometries. Such deformations directly affect the accumulation of misorientations, formations of low-angle grain boundaries (LAGB), and in some cases, fragmentation of the dendritic domains. Therefore, thermomechanical deformations play a crucial role in the final microstructure development and a better understanding of such mechanisms will help design tailored microstructures with superior mechanical properties for novel material systems. We employ operando x-ray diffraction to study these important thermomechanical processes. X-ray diffraction analyses are usually represented in the standard form of Bragg’s law (2θ vs. Intensity) to reveal details such as the lattice plane spacing and crystal structure. However, non-standard analyses such as quantifying the azimuthal change vs. time along specific diffraction peaks may reveal the rotation of lattice planes, with spread along the azimuth and intensity fluctuations representing rigid body rotations such as torsion and bending. Therefore, we use azimuthal angle vs. time graphs in our study to analyze individual sets of lattice planes to reveal these thermomechanical deformations.
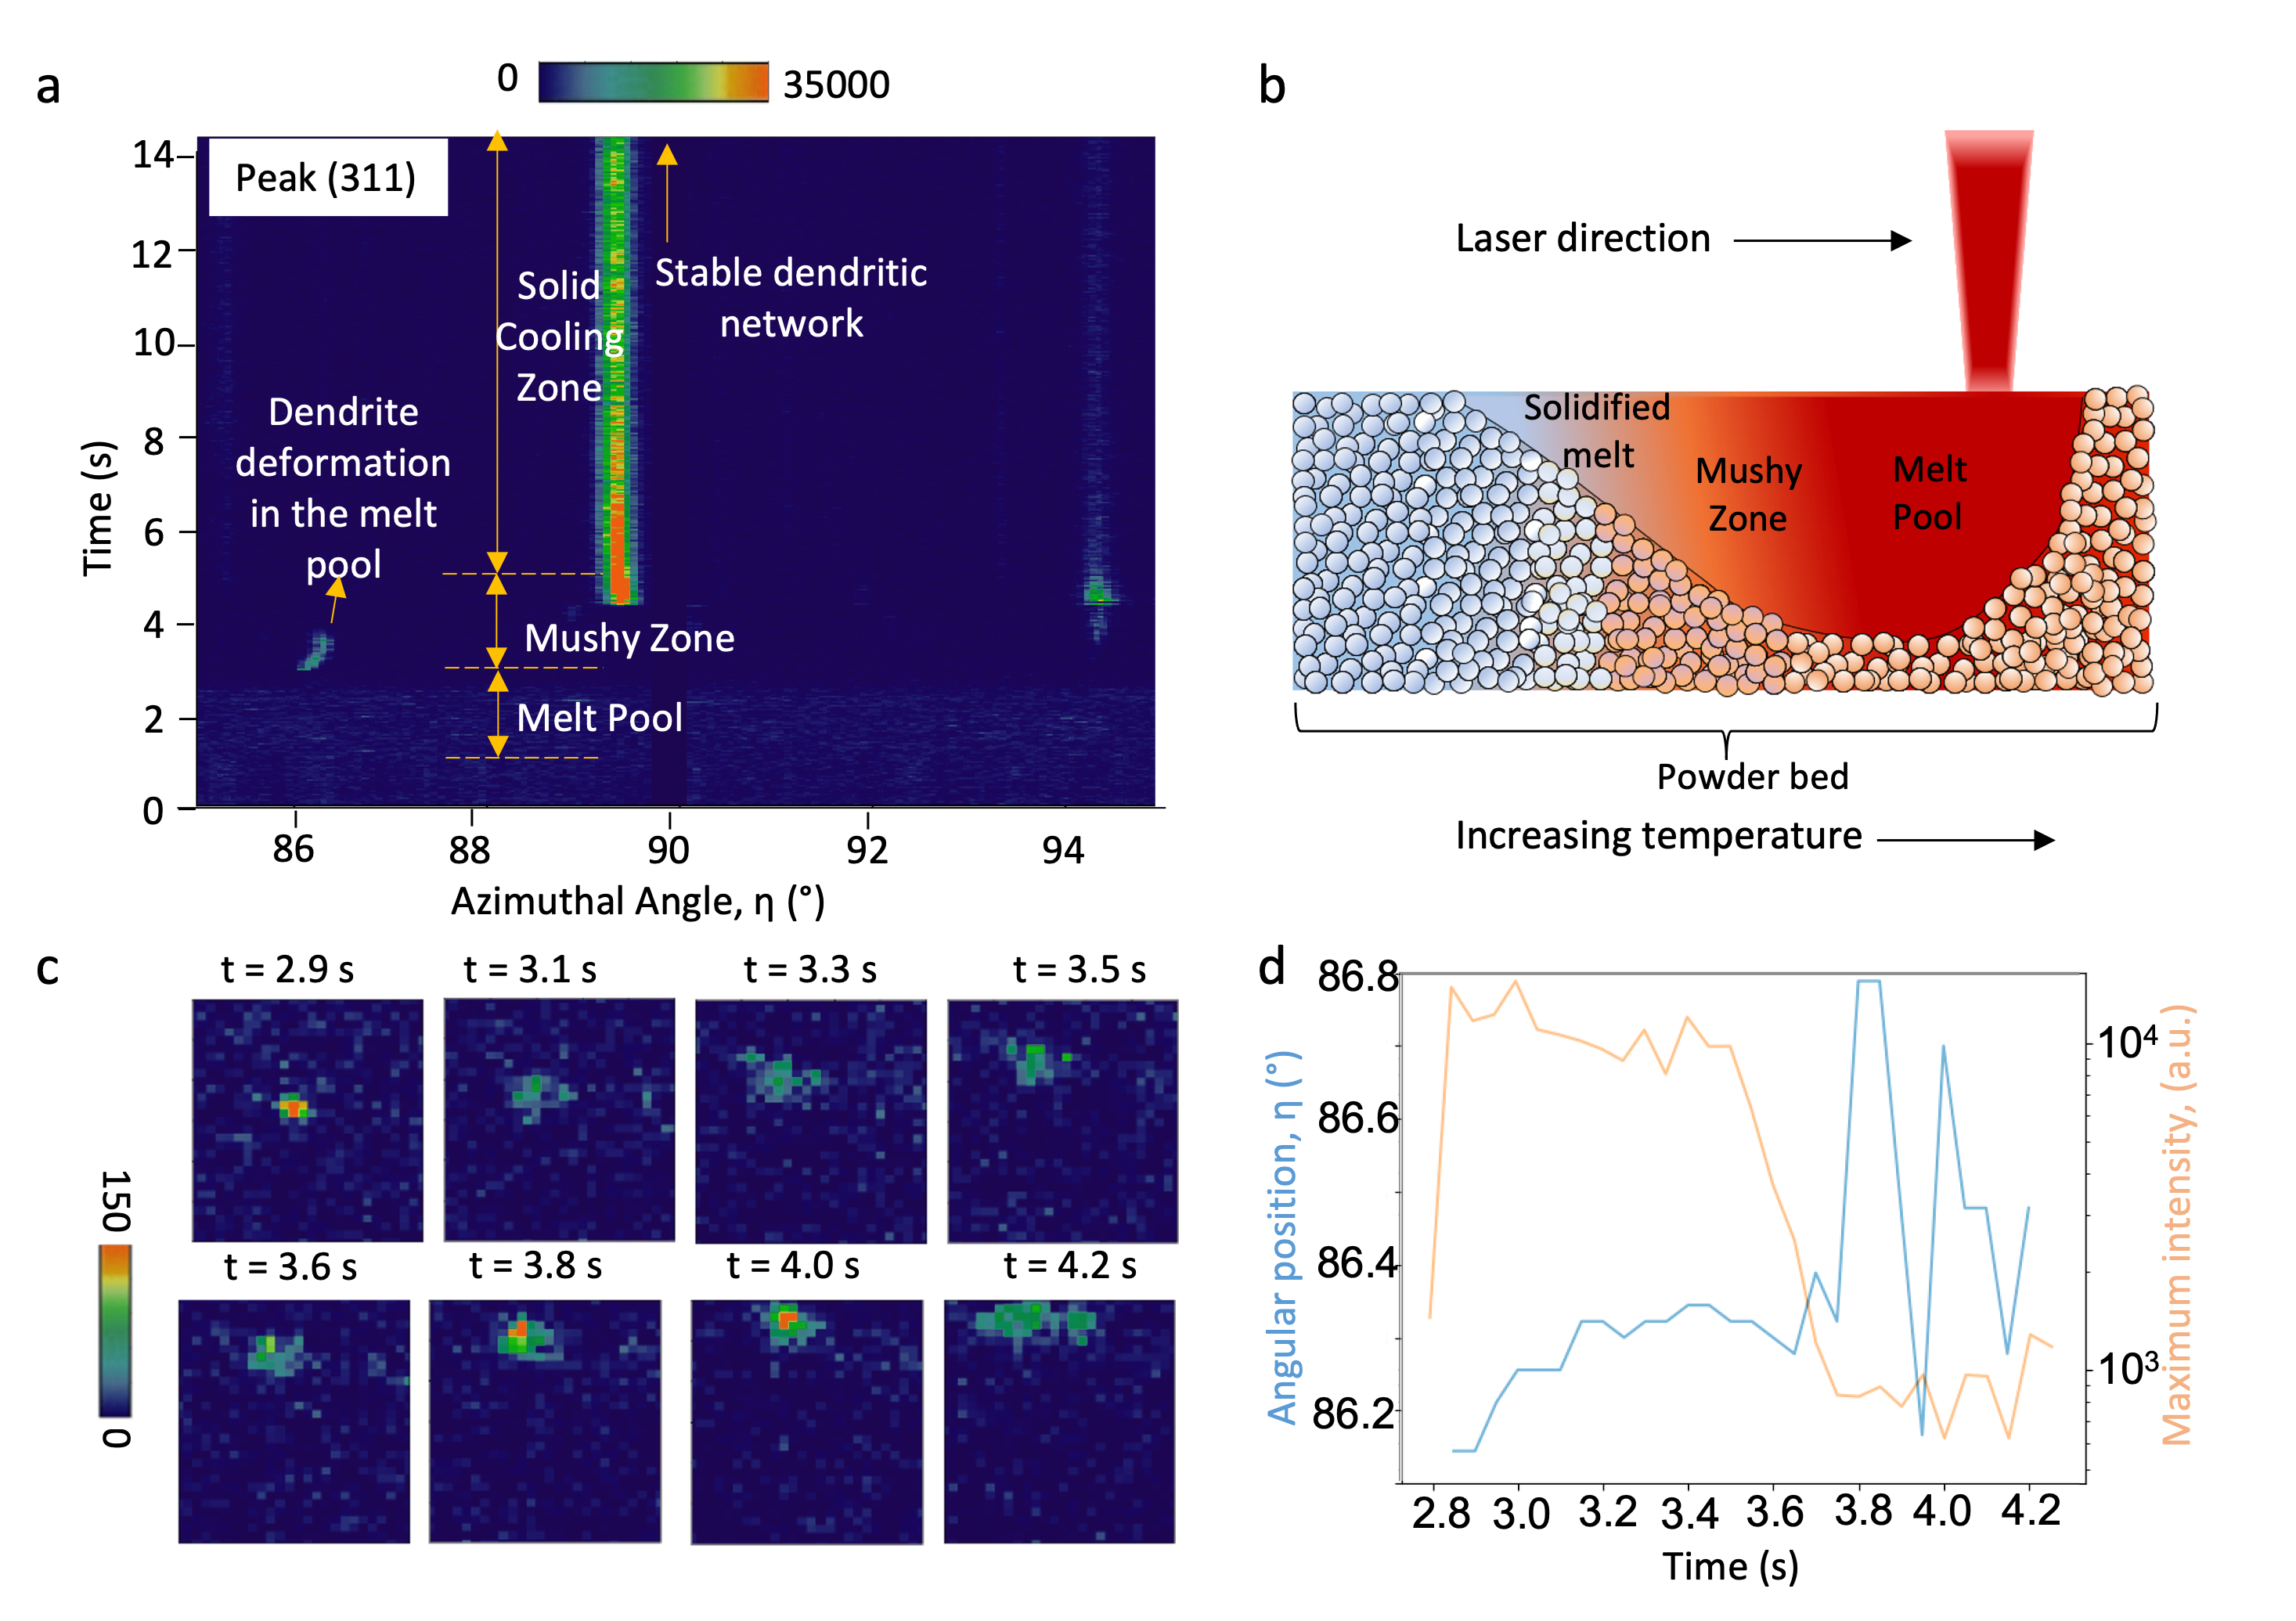
Azimuthal angle versus time plot for the {311} family of lattice planes is shown in Figure 5a to study the evolution of x-ray diffraction through solidifying Inconel 625 alloy during AM. The schematic in Figure 5b highlights the stages of solidification, which is captured by the x-ray beam passing through the melt pool, the mushy zone, and the solid cooling zone, revealing different diffracted intensities. The absence of intensity corresponds to a lack of sufficient crystalline solids in the melt pool during the early stages of solidification. The appearance of intermittent diffracted intensity and abrupt shifts in azimuthal angles and intensity is observed in the mushy zone revealing various dendritic thermomechanical deformation mechanisms. In the solid cooling zone, the diffracted intensity remains unchanged since most of the microstructural features are already developed at that point. Figure 5c shows the time-resolved evolution of the {311} diffraction peak showing an appreciable spread along the azimuthal curve with fluctuations in intensity, with the Figure 5d quantifying such time-resolved shifts. As mentioned before, this spread along the azimuth, and its intensity fluctuations can be associated with thermomechanical deformations. From the EBSD of the sample cross-section, the median intragranular misorientation within grains likely caused due to the torsion and bending forces are estimated to be 0.45°- 0.52°, which is in close agreement with the maximum difference of ~0.65° along the azimuth as observed from the x-ray diffraction data in Figure 5d.
Figure 5: (a) The azimuthal angle vs. time graph for the {311} family of lattice planes, highlighting the regions of the melt pool, the mushy zone, and the solid cooling zone; (b) The schematic highlighting the different stages of solidification for a laser rastering on a powder bed; (c) the zoomed-in view of how the diffraction spot changes along azimuth and intensity with time directly from the 2D raw detector; (d) The graph shows the quantitative estimates of angular position and maximum intensity vs. time from the tracked 2D detector spot to estimate fluctuations in lattice plane orientations and rigid body rotations respectively.
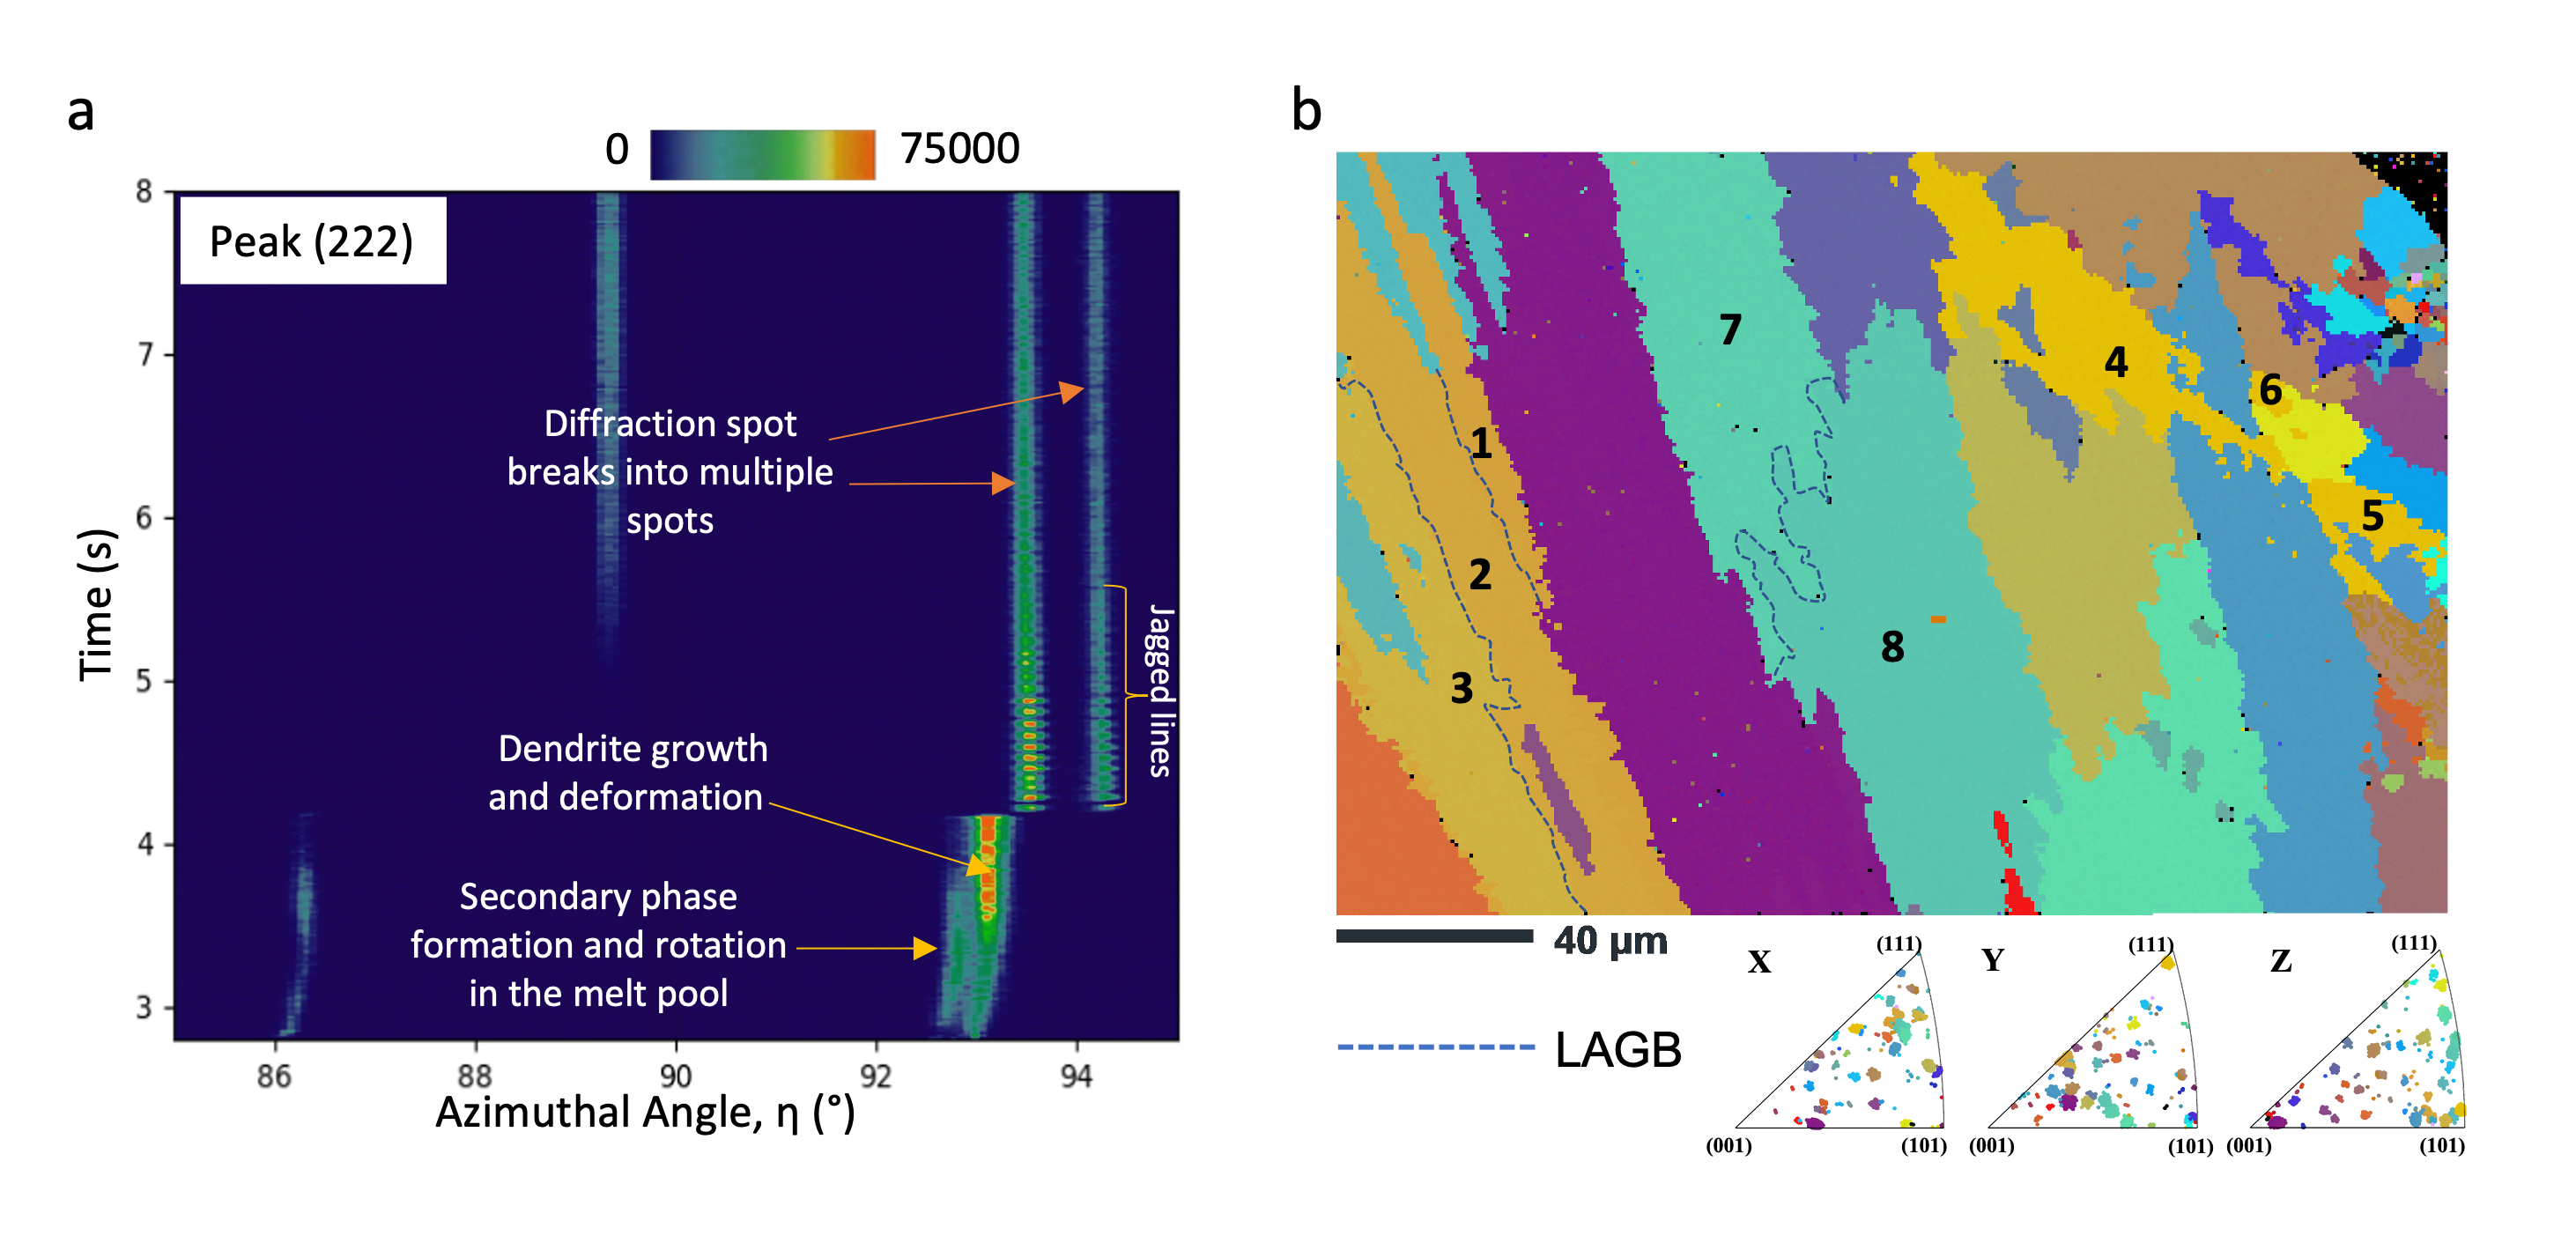
Apart from thermomechanical deformations causing rigid body rotations, other deformation mechanisms which impact the microstructural features during the latter stages of solidification can also be identified from azimuthal angle vs. time curves. An example is shown for the {222} family of lattice planes in Figure 6a, which shows two major events: (i) The highlighted diffraction spot at h=93° splitting into at least two spots, and the possible mechanisms for this include local re-melting, fragmentation of the secondary arm, or assimilation of dendritic trunks. The EBSD data in the form of an Euler angles map in Figure 6b supports these observations, showing the feasible grain candidates for the observed spot-splitting phenomena as captured by the operando diffraction experiment (note that a detailed procedure was developed to correlate the EBSD data to x-ray diffraction data in [9]). From Figure 6b, the possible grains undergoing this mechanism are grains 1, 2, 3, and 4, 5, 6, wherein the grain group 1,2 and 3 correspond to the assimilation of dendrites into one grain with LAGB formation and grain groups 4,5 and 6 highlight the dendritic fragmentation process, respectively; (ii) the jagged lines in Figure 6a corresponds to the oscillatory motion of the diffracting domains, caused by opposing flows inducing repeated self-excited motions in a constrained region. Such oscillatory motions may lead to the bending of dendrites and result in the formation of LAGBs due to intragranular misorientations, similar to grains 7 and 8 shown in Figure 6b. The oscillation period depends on the solidification stage and the melt pool/mushy zone size, and it starts to decay when interdendritic growth anchors the moving dendritic network.
Figure 6: (a) the azimuthal angle vs. time graph for the {222} family of lattice planes, highlighting the unique thermomechanical deformation phenomena; (b) the Euler angle map highlighting the grain groups undergoing the probable thermomechanical deformation phenomena as observed by the operando by x-ray diffraction graph, with dotted lines being the LAGBs.
V. Summary and outlook
In summary, synchrotron X-ray diffraction is employed to understand the solidification physics and their role on resulting microstructure in steels, high entropy alloys, and nickel-based alloy. Observed phenomena such as solidification pathway and deformation can be correlated to post-mortem characterization of the prints to gain a fundamental understanding of the complex AM process [13-16]. These observations are complementary to many synchrotron imaging not only in PBF and DED systems but also in electron beam melting [17]. With AM being successfully integrated into design and manufacturing of many industries, the demand for high-quality parts production increases. However, several challenges remain in order for AM products to be more widely applied. An example of such challenge is the tradeoff between temporal and spatial resolution inherent to the time-resolved X-ray diffraction experiments. One solution, as discussed in the current post, is to integrate multiple detectors that can achieve either high temporal or spatial resolution to reach a better understanding of the fast-evolving process. Alternately, simultaneous integration of diffraction and imaging can be helpful to gain various information about the process such as solidification front velocity and melt pool dynamics. In addition, the current maximum spatial and temporal resolution attainable on in-situ XRD is still a few orders of magnitude too low to probe the fast dynamics of PBF (10^6-10^8 K/s); thus, improvements on beamline and detector characteristics are necessary by increasing brilliance and beam flux. These upgrades would enable the investigation of defect formation, stress evolution, and phase transformation kinetics in various processing conditions. In addition, operando small angle x-ray scattering (SAXS) during AM is a promising technique that could give us critical insights into the early stages of solidification. All in all, reaching a fundamental understanding of the physical mechanisms will aid in tackling the common issue in AM of texture evolution, defect formation and cracking during solidification. Ultimately, these findings can be leveraged to design specific microstructures with targeted properties. After gaining a comprehensive understanding of the research findings, it is necessary to establish correlations that can be applied in industrial settings for broader adoption and translation of the research.
VI. Ackmowledgment
I would like to extend a special thanks to my students, Akane Wakai and Adrita Dass, for their valuable contribution to this blog post.
References
[1] D.L. Bourell, Perspectives on Additive Manufacturing, Annu. Rev. Mater. Res. (2016). https://doi.org/10.1146/annurev-matsci-070115-031606.
[2] S. Bhattacharya, J. Bustillos, F.Q. Gonzalez, J.A. Spector, A. Moridi, Biomedical Applications of Metal Additive Manufacturing: Current State-of-the-Art and Future Perspective, Am. J. Biomed. Sci. Res. 7 (2020) 6–10. https://doi.org/10.34297/ajbsr.2020.07.001103.
[3] S. Alipour, A. Moridi, F. Liou, A. Emdadi, The Trajectory of Additively Manufactured Titanium Alloys with Superior Mechanical Properties and Engineered Microstructures, Addit. Manuf. 60 (2022) 103245. https://doi.org/https://doi.org/10.1016/j.addma.2022.103245.
[4] A. Dass, A. Moridi, State of the Art in Directed Energy Deposition: From Additive Manufacturing to Materials Design, Coatings. 9 (2019) 418. https://doi.org/10.3390/coatings9070418.
[5] S.K. Everton, M. Hirsch, P.I. Stavroulakis, R.K. Leach, A.T. Clare, Review of in-situ process monitoring and in-situ metrology for metal additive manufacturing, Mater. Des. 95 (2016) 431–445. https://doi.org/10.1016/j.matdes.2016.01.099.
[6] C. Ioannidou, H.H. König, N. Semjatov, U. Ackelid, P. Staron, C. Körner, P. Hedström, G. Lindwall, In-situ synchrotron X-ray analysis of metal Additive Manufacturing: Current state, opportunities and challenges, Mater. Des. 219 (2022) 110790. https://doi.org/10.1016/j.matdes.2022.110790.
[7] A. Dass, A. Gabourel, D. Pagan, A. Moridi, Laser based directed energy deposition system for operando synchrotron x-ray experiments Laser based directed energy deposition system for operando synchrotron x-ray experiments, Rev. Sci. Instrum. 075106 (2022). https://doi.org/10.1063/5.0081186.
[8] B.H. Toby, R.B. Von Dreele, GSAS-II: the genesis of a modern open-source all purpose crystallography software package, J. Appl. Crystallogr. 46 (2013) 544–549. https://doi.org/10.1107/S0021889813003531.
[9] A. Dass, C. Tian, D.C. Pagan, A. Moridi, Dendritic deformation modes in additive manufacturing revealed by operando x-ray diffraction, Under review.
[10] A. Wakai, A. Das, J. Bustillos, A. Moridi, Effect of solidification pathway during additive manufacturing on grain boundary fractality, Under review.
[11] T.G. Langdon, Grain boundary sliding revisited: Developments in sliding over four decades, J. Mater. Sci. 41 (2006) 597–609. https://doi.org/10.1007/s10853-006-6476-0.
[12] M. Tanaka, The fractal dimension of grain-boundary fracture in high-temperature creep of heat-resistant alloys, J. Mater. Sci. 28 (1993) 5753–5758. https://doi.org/10.1007/BF00365177.
[13] C. Zhao, K. Fezzaa, R.W. Cunningham, H. Wen, F. De Carlo, L. Chen, A.D. Rollett, T. Sun, Real-time monitoring of laser powder bed fusion process using high-speed X-ray imaging and diffraction, Sci. Rep. 7 (2017) 1–11. https://doi.org/10.1038/s41598-017-03761-2.
[14] C.L.A. Leung, S. Marussi, R.C. Atwood, M. Towrie, P.J. Withers, P.D. Lee, In situ X-ray imaging of defect and molten pool dynamics in laser additive manufacturing, Nat. Commun. 9 (2018) 1–9. https://doi.org/10.1038/s41467-018-03734-7.
[15] R. Cunningham, C. Zhao, N. Parab, C. Kantzos, J. Pauza, K. Fezzaa, T. Sun, A.D. Rollett, Keyhole threshold and morphology in laser melting revealed by ultrahigh-speed x-ray imaging, Science (80-. ). (2019). https://doi.org/10.1126/science.aav4687.
[16] Y. Chen, S.J. Clark, D.M. Collins, S. Marussi, S.A. Hunt, D.M. Fenech, T. Connolley, R.C. Atwood, O. V Magdysyuk, G.J. Baxter, M.A. Jones, C.L.A. Leung, P.D. Lee, Correlative Synchrotron X-ray Imaging and Diffraction of Directed Energy Deposition Additive Manufacturing, Acta Mater. 209 (2021) 116777. https://doi.org/https://doi.org/10.1016/j.actamat.2021.116777.
[17] L.I. Escano, S.J. Clark, A.C. Chuang, J. Yuan, Q. Guo, M. Qu, W. Dong, X. Zhang, J. Huang, K. Fezzaa, P. Kenesei, B.J. Walker, T. Sun, K.W. Eliceiri, L. Chen, An electron beam melting system for in-situ synchrotron X-ray monitoring, Addit. Manuf. Lett. 3 (2022) 100094. https://doi.org/10.1016/j.addlet.2022.100094.
| Attachment | Size |
|---|---|
| Figure 1.png | 158.58 KB |
| Figure 2.png | 298.73 KB |
| Figure 3.png | 1.82 MB |
| Figure 4.png | 1.08 MB |
| Figure 5.png | 2.6 MB |
| Figure 6.png | 1.61 MB |
Monitoring Stress Evolution in the Future?
Nice description of current work.
These in situ synchrotron measurements are great at monitoring microstructure evolution and large thermal lattice distortions as they produce commensurately large changes to diffracted signal. Do you have thoughts on the path forward for monitoring mechanical response / stress evolution which produces much subtler changes in diffraction patterns?
In reply to Monitoring Stress Evolution in the Future? by dcp5303
Thanks Darren for the comment
Thanks Darren for the comment, I think to improve the spatial resolution of X-ray measurements, measures can be taken during both data acquisition and analysis. Using a highly monochromatic beam during data acquisition may be beneficial, as well as utilizing detector images without data reduction and integration during analysis
Analyses of diffraction data
Very nice discussion on the in situ diffraction data! I have a few questions and comments.
1. Diffraction peaks in Fig. 2 appear to be asymmetric. Some even split into multiple peaks. Any clue why this is the case? Are these artifacts or they contain real structure information? Did the cooling-induced diffraction peak shift captured in one diffraction pattern due to the long exposure?
2. The discussion on the grain morphology (Fig. 3) is very interesting. Have you measured the creep performance of these samples to correlate it with the fractal grains?
3. Analyses shown in Figs. 5 and 6 point to a new direction for extracting more structure information from these in situ diffraction data. There are too many factors in the AM process that may alter the diffraction pattern. Although I feel the real situation may be more complex than the authors described, this is certainly a good starting point to expand discussion.
Re. Analysis of diffraction data
Thanks Tao for the comments,
1-Powder diffraction peaks exhibit asymmetry even before printing, which may partly be an artifact. Nonetheless, as the process advances, changes in peak shape occur, which I believe contain real structural information. Notably, during the initial phases of solidification, the peak shapes experience considerable changes mainly because the exterior of the bead cools faster than its interior. Peak splitting specially at the later stages of solidification could be due to elemental segregation.
2. Not yet, would be an interesting future work.
3. I agree, perhaps we can catch up during TMS to discuss this further!